Blogs

Read the tape.
Then read the write-up.

Order flow breakdowns, signal walkthroughs, and release notes — written for traders who already know what a footprint chart is.
Latest
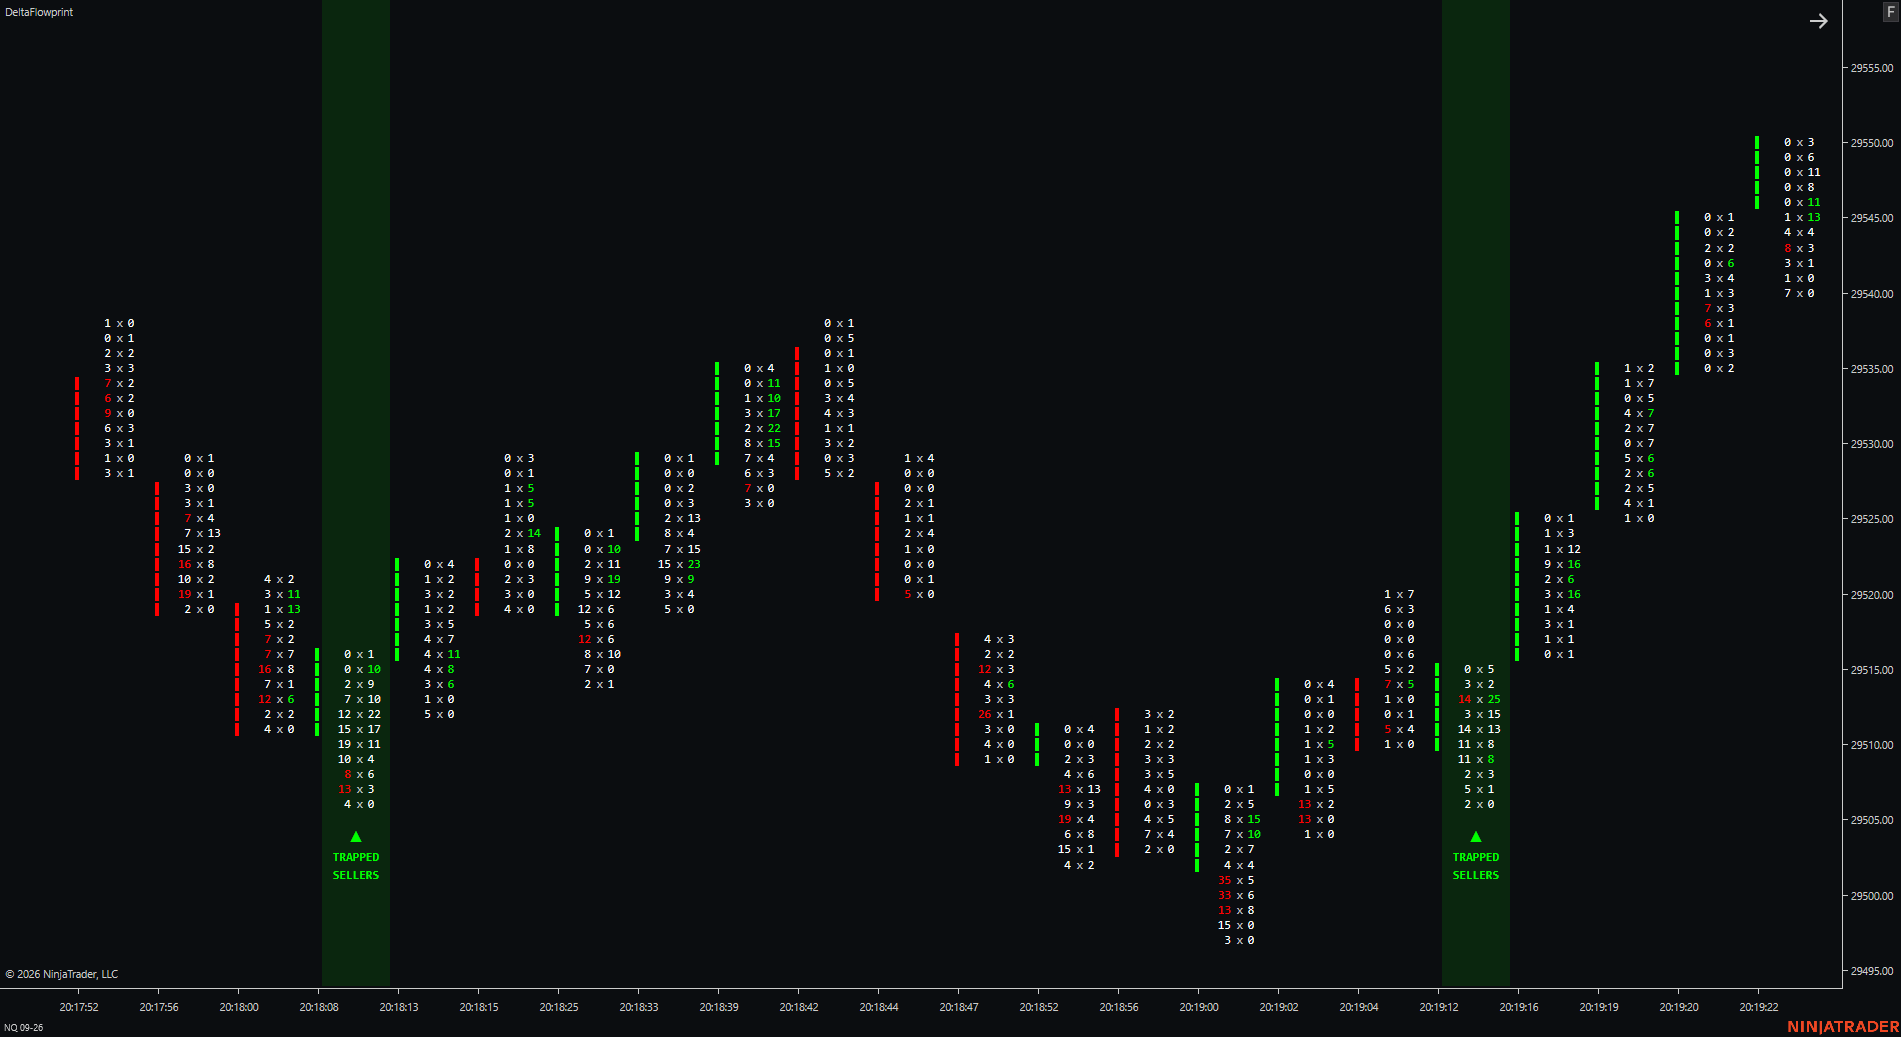
Reading Trapped Sellers Live: Three NQ Examples From This Week
Signals
Reading Trapped Sellers Live: Three NQ Examples From This Week

Three closed bars, three different contexts. Why the same signal means something different at the open than it does mid-session.

Jul 14, 2026 6 min read
Read the breakdown →
All Posts

Every write-up,
one feed.

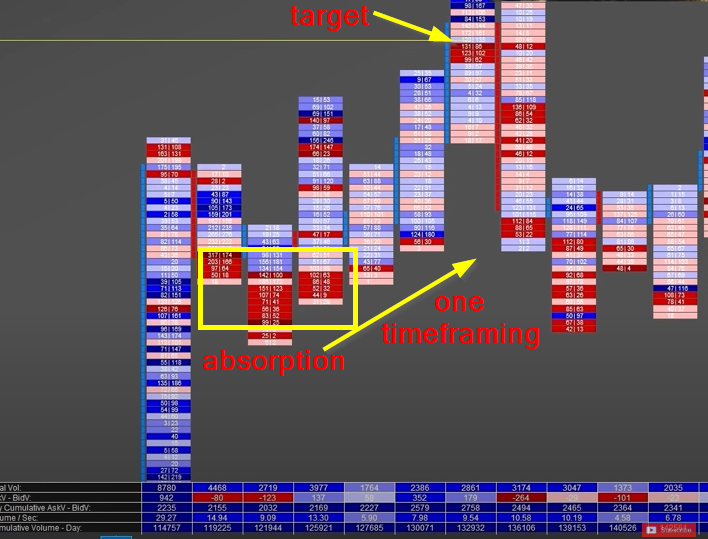
Absorption vs. Exhaustion: They Look Identical Until They Don't

Both show heavy volume with no price progress. Here's the one footprint detail that tells them apart before the next bar opens.
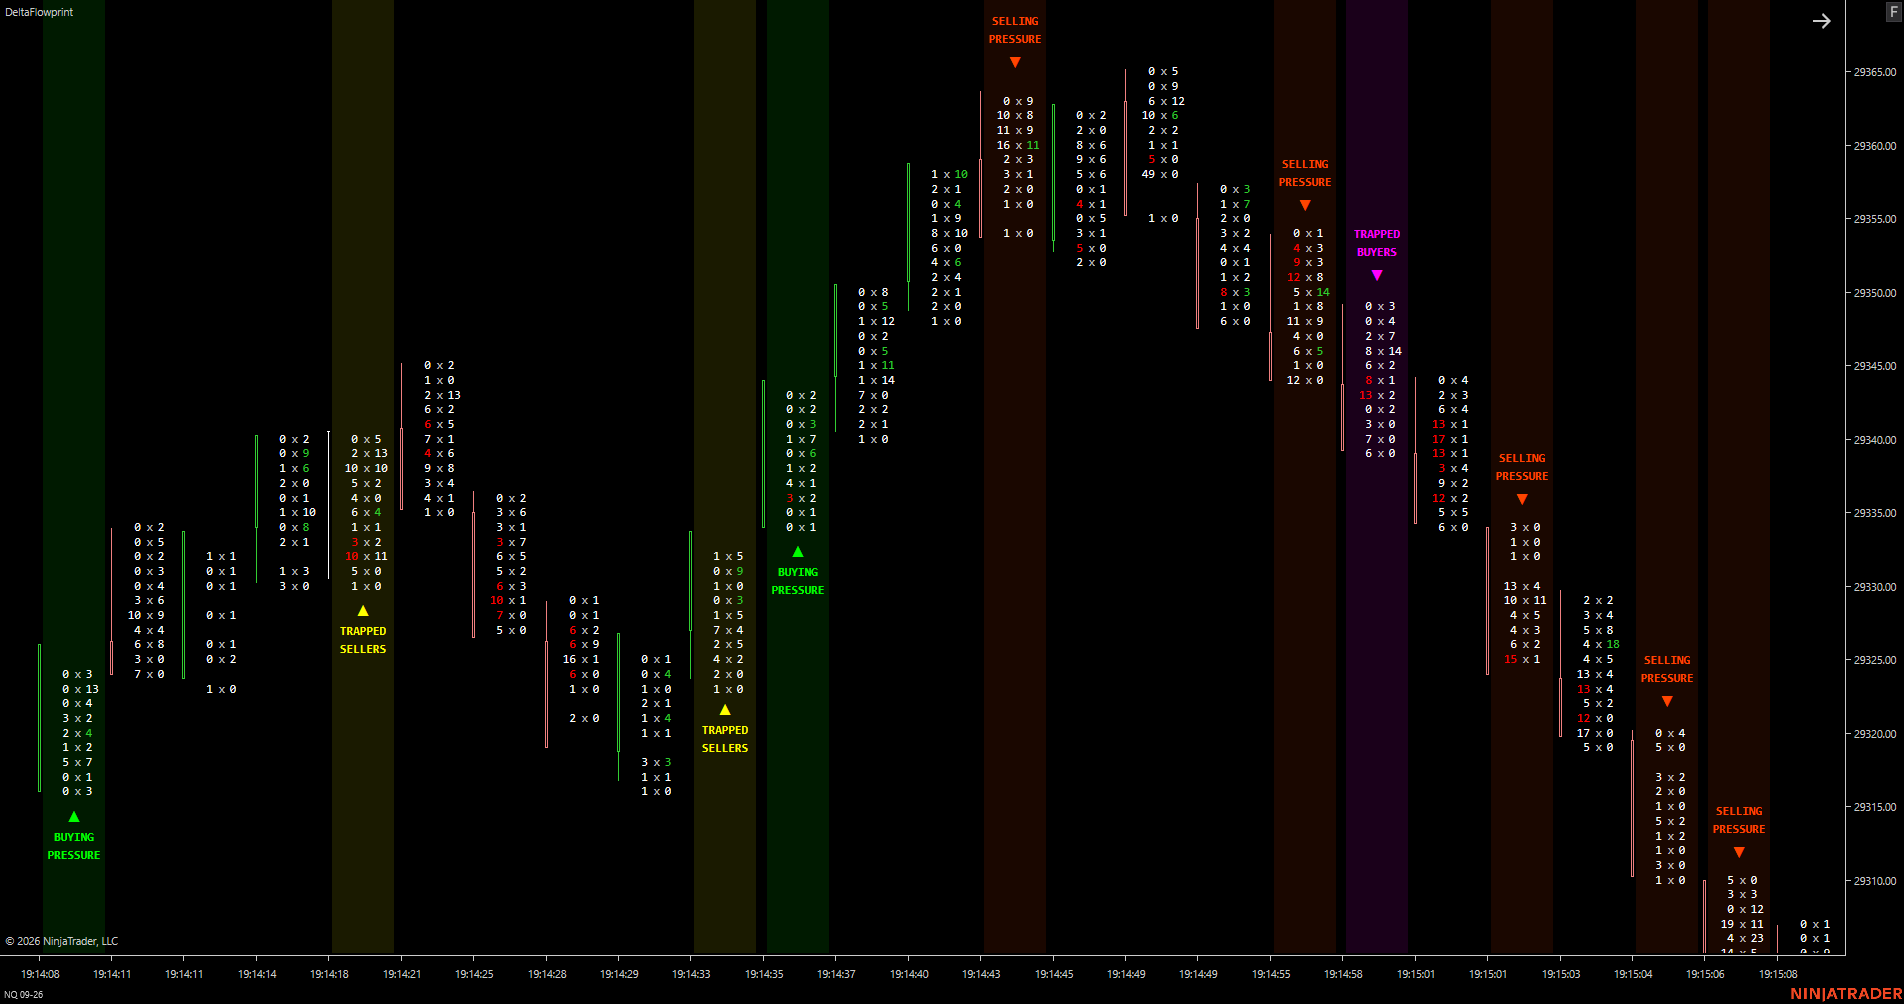
Picking a Range Size for Footprint Charts (10 vs 40 vs Tick)

Range bars compress noise but hide context. A practical framework for matching range size to the instrument you trade.
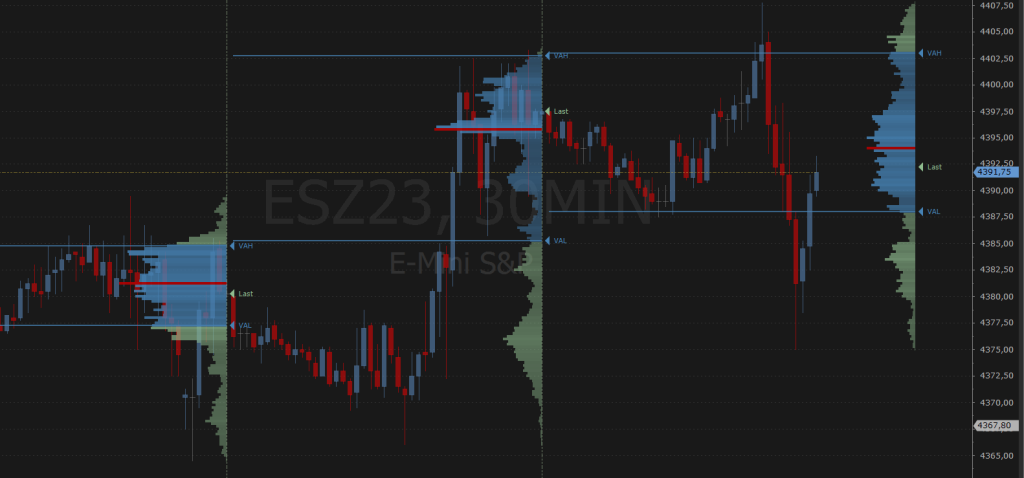
Trading Back Into Value: A Simple VAH/VAL Framework

Session profile gives you the map. Delta gives you the timing. Neither works alone.
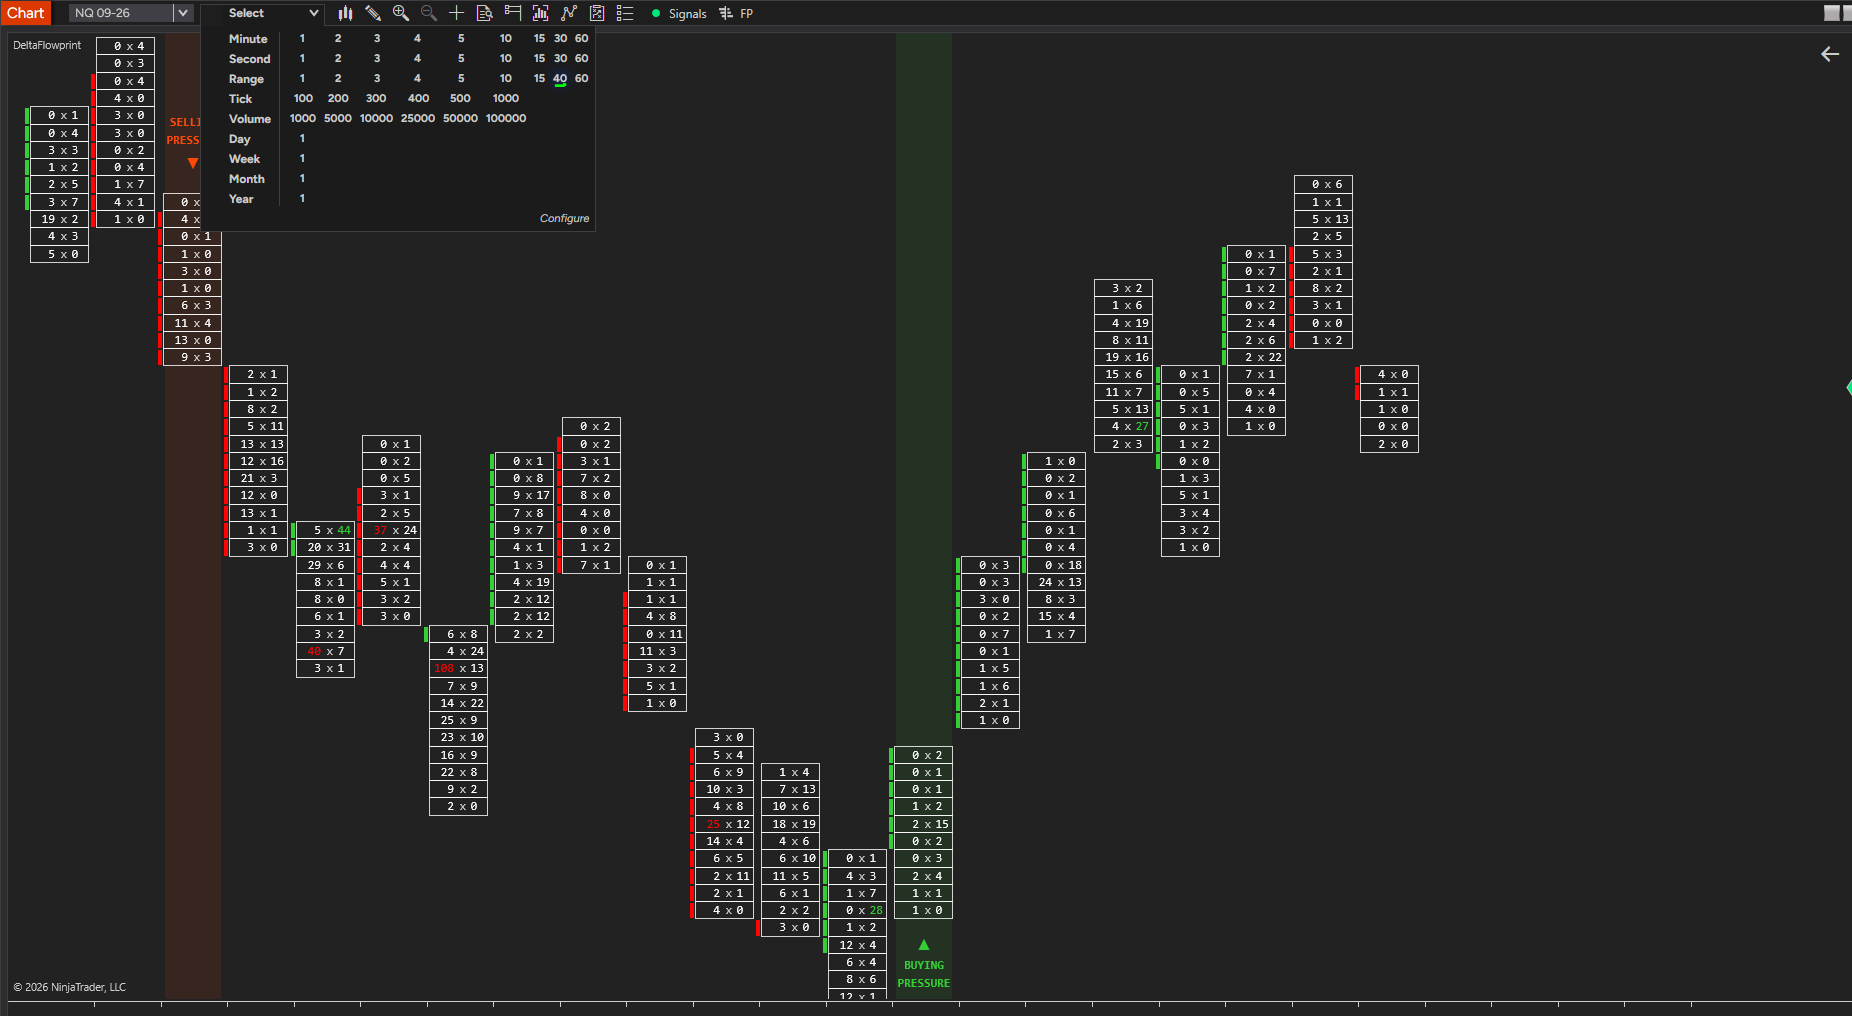
Fading Stop Hunts on NQ Without Getting Run Over

The sweep is easy to spot. The absorption that confirms it is the part most traders skip.
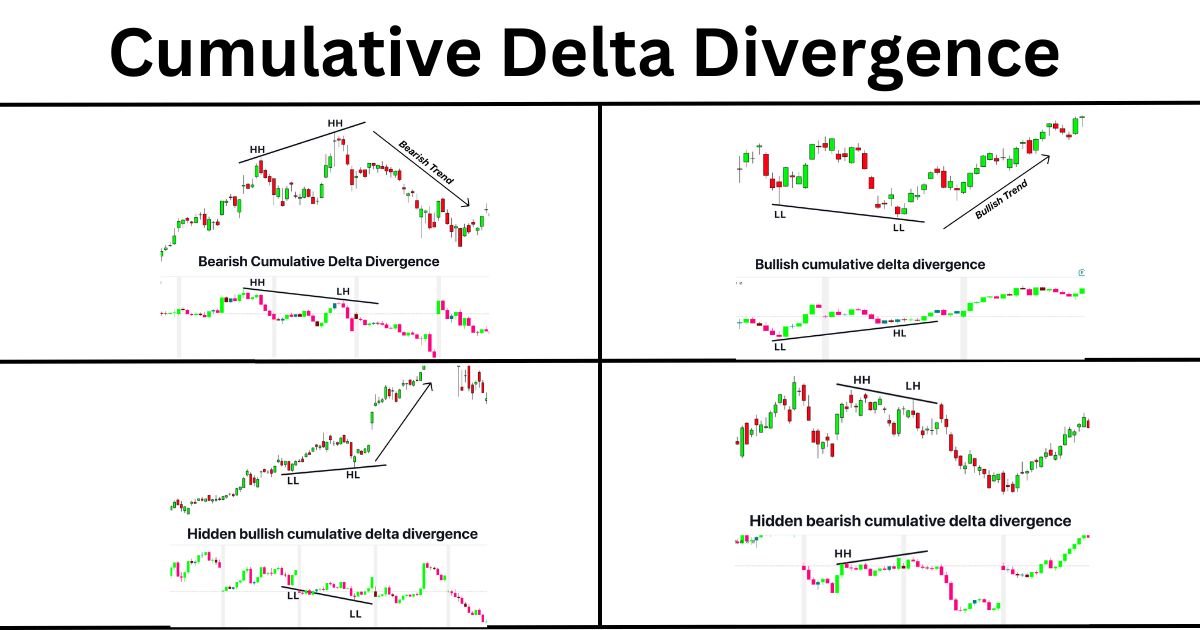
Cumulative Delta Divergence: Leading Indicator or Noise?

It leads price often enough to matter — and fails often enough to need a filter. Here's the filter.