Absorption and exhaustion produce the same surface pattern: a heavy-volume bar that goes nowhere. Traders conflate them constantly because from a candle alone, there is no way to tell them apart. The footprint is where they split.
What they have in common
Both show a bar with volume well above the session average and a small range relative to that volume. Both show up at levels that matter — prior highs, prior lows, session VAH/VAL. Both look, on a candlestick chart, like indecision.
Where they diverge
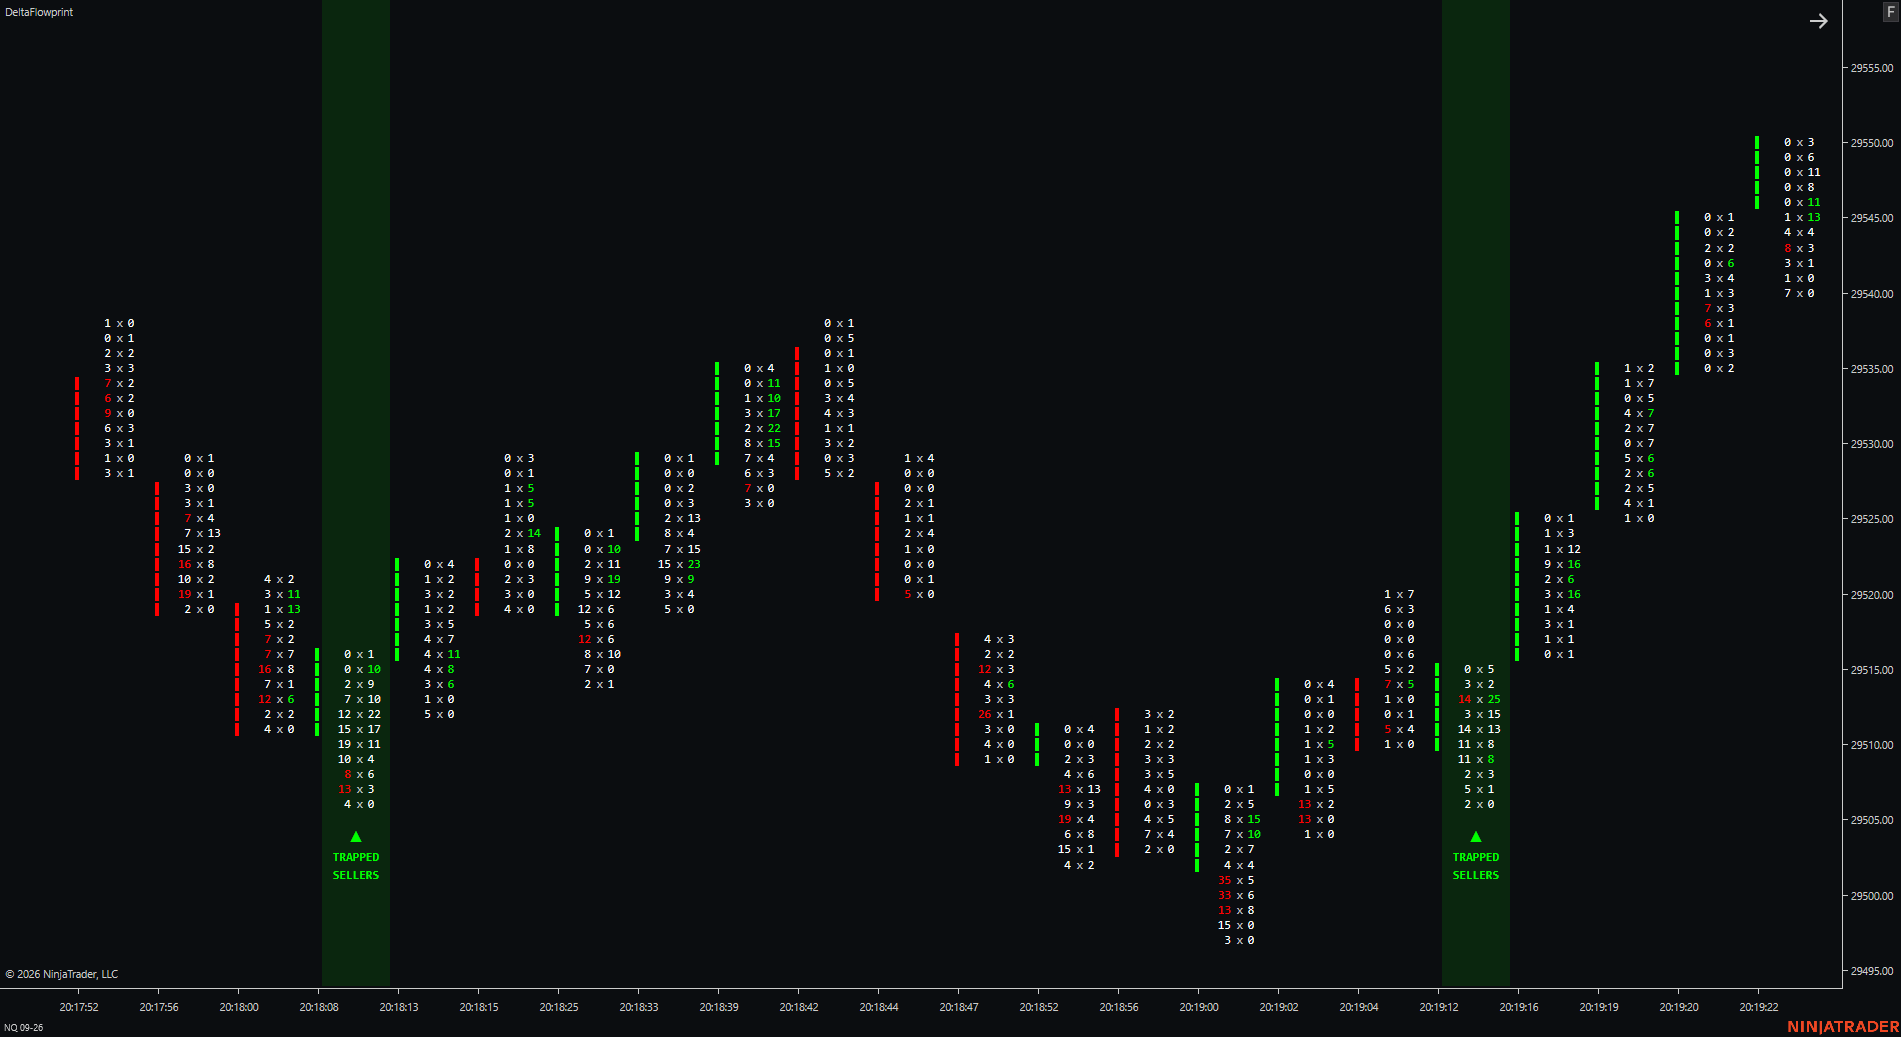
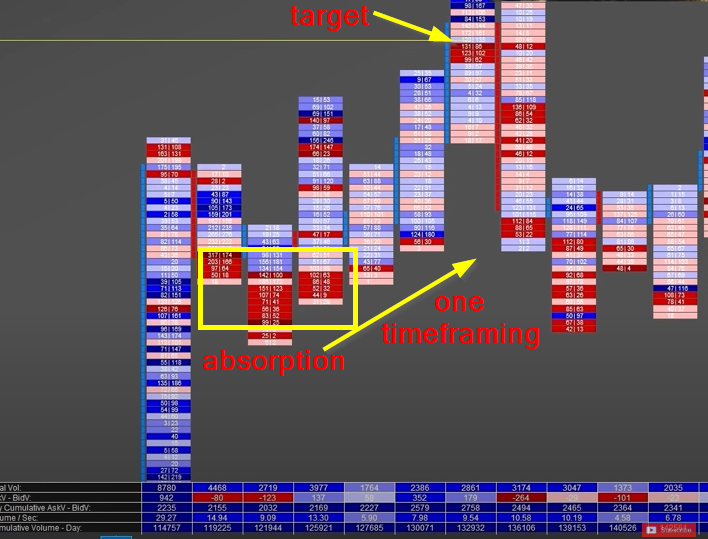
Absorption shows one side of the tape getting consistently filled without giving ground — heavy ask hitting a level and being met tick-for-tick by resting bid, with the bid side never thinning out across the bar. Exhaustion shows the opposite texture: the aggressive side's volume decays across the bar even though the total looks large, because it front-loaded early and dried up by the close.
The practical check: split the bar into thirds. If the aggressive volume is roughly even across all three, that is absorption — the passive side is winning a sustained fight. If the aggressive volume is concentrated in the first third and fades by the last third, that is exhaustion — the aggressive side ran out of orders, not conviction.
Why it matters for the next bar
Absorption tends to resolve in the direction of the passive side once the aggressive side gives up. Exhaustion tends to resolve in the direction the aggressive side was originally pushing, once a fresh wave of orders arrives. Trading them the same way is the single most common footprint misread.