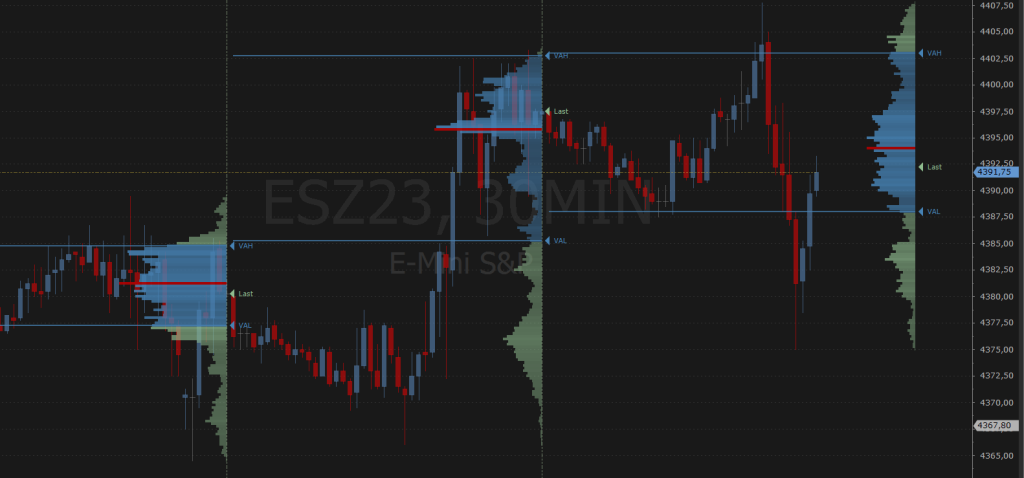
Value Area High and Value Area Low mark the boundaries of the 68.2% of volume around the session POC. Price spends most of its time inside that band — which is exactly why a clean move outside it, followed by a clean move back in, is one of the more reliable mean-reversion setups available on a footprint.
The map: where VAH/VAL come from
The value area is not a prediction, it is a description of where the market has already agreed value sits for this session. Price outside it is being tested; price back inside it is being accepted.
The timing: what delta adds
The map alone will have you fading every excursion outside the value area, which fails constantly during trend days. What separates a reversion setup from a trend day is what delta does at the boundary: reversion setups show delta rolling over as price re-enters the value area, trend days show delta continuing to build in the breakout direction even as price stalls.
A simple sequence
- Price trades outside VAH or VAL.
- Price re-enters the value area.
- Delta on the re-entry bar confirms — opposing the original breakout direction.
- Enter toward POC, with a stop back outside the value area boundary.
This is a framework, not a signal that fires automatically — treat it as a lens for reading the Volume Profile mode alongside the bar-level delta you already have on the chart.