Range size is the setting most traders copy from a forum post and never revisit. It should be a function of the instrument's tick value and typical intrabar movement, not a number that felt right on someone else's chart.
Why range size matters more on a footprint than a candle chart
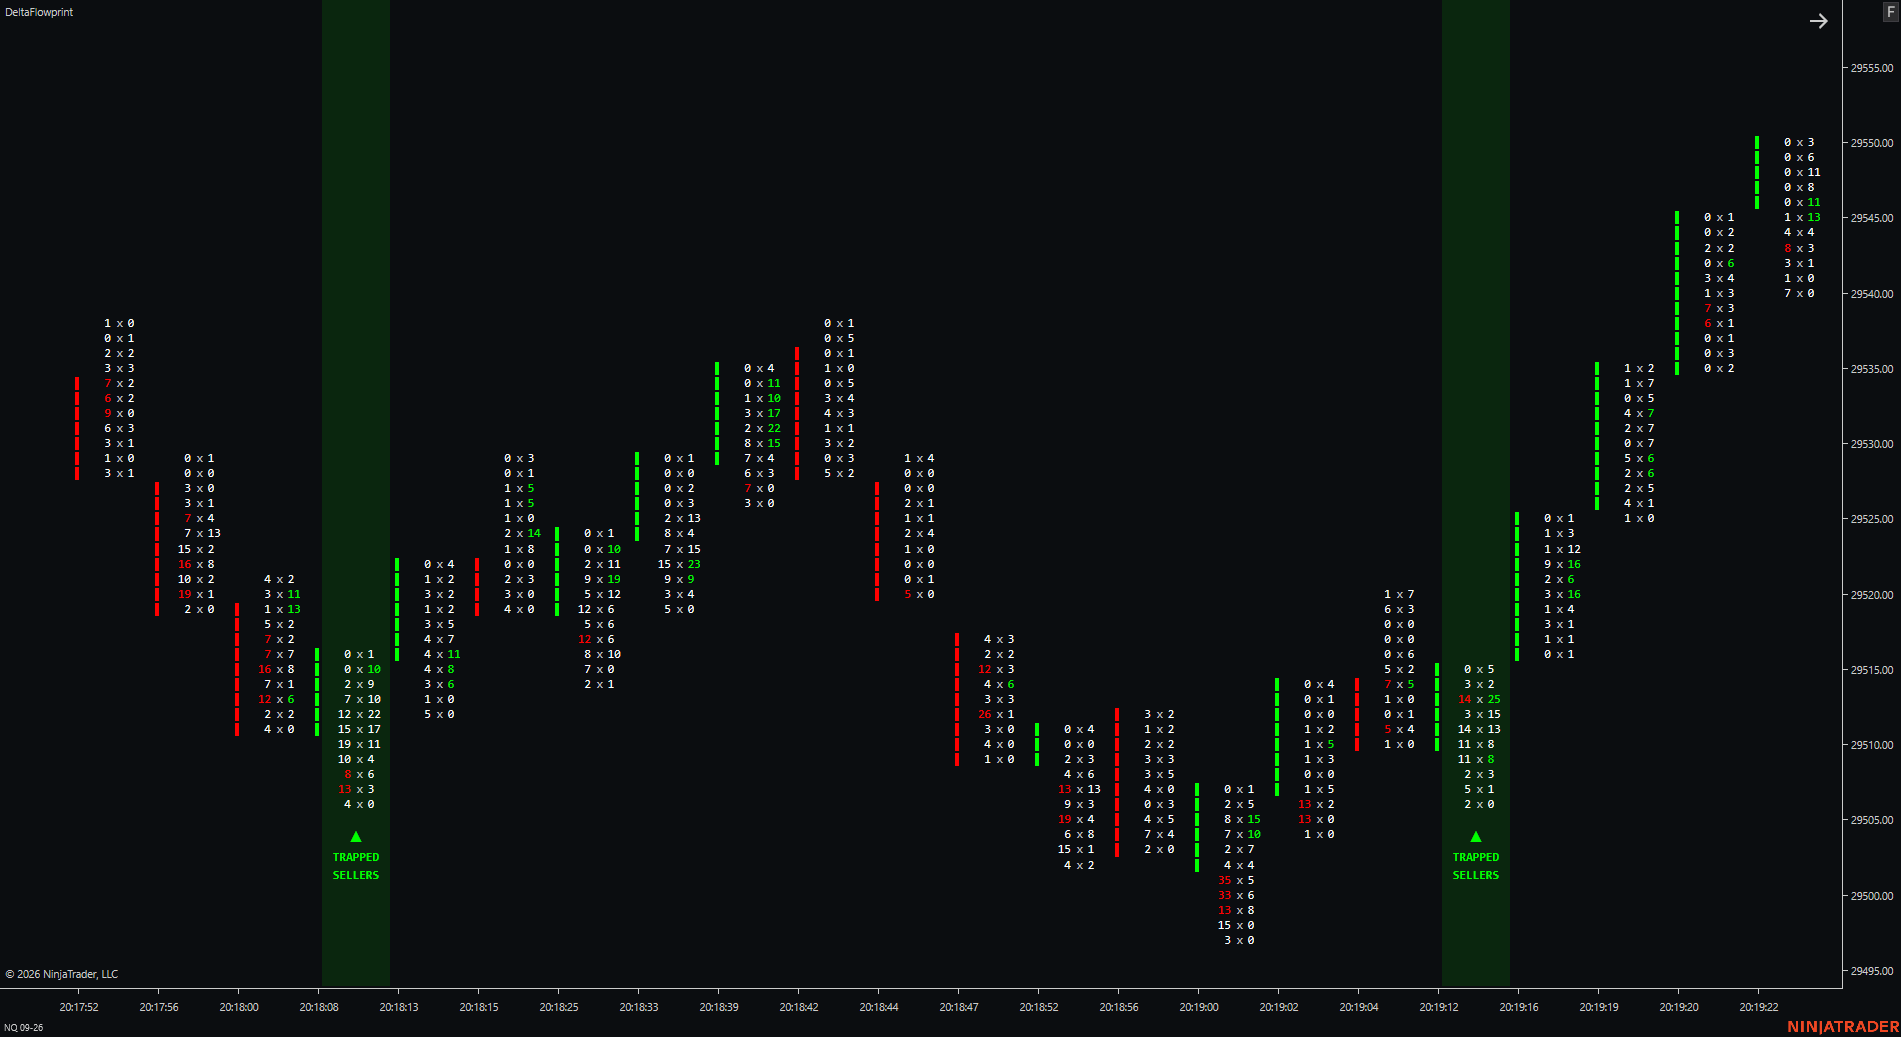
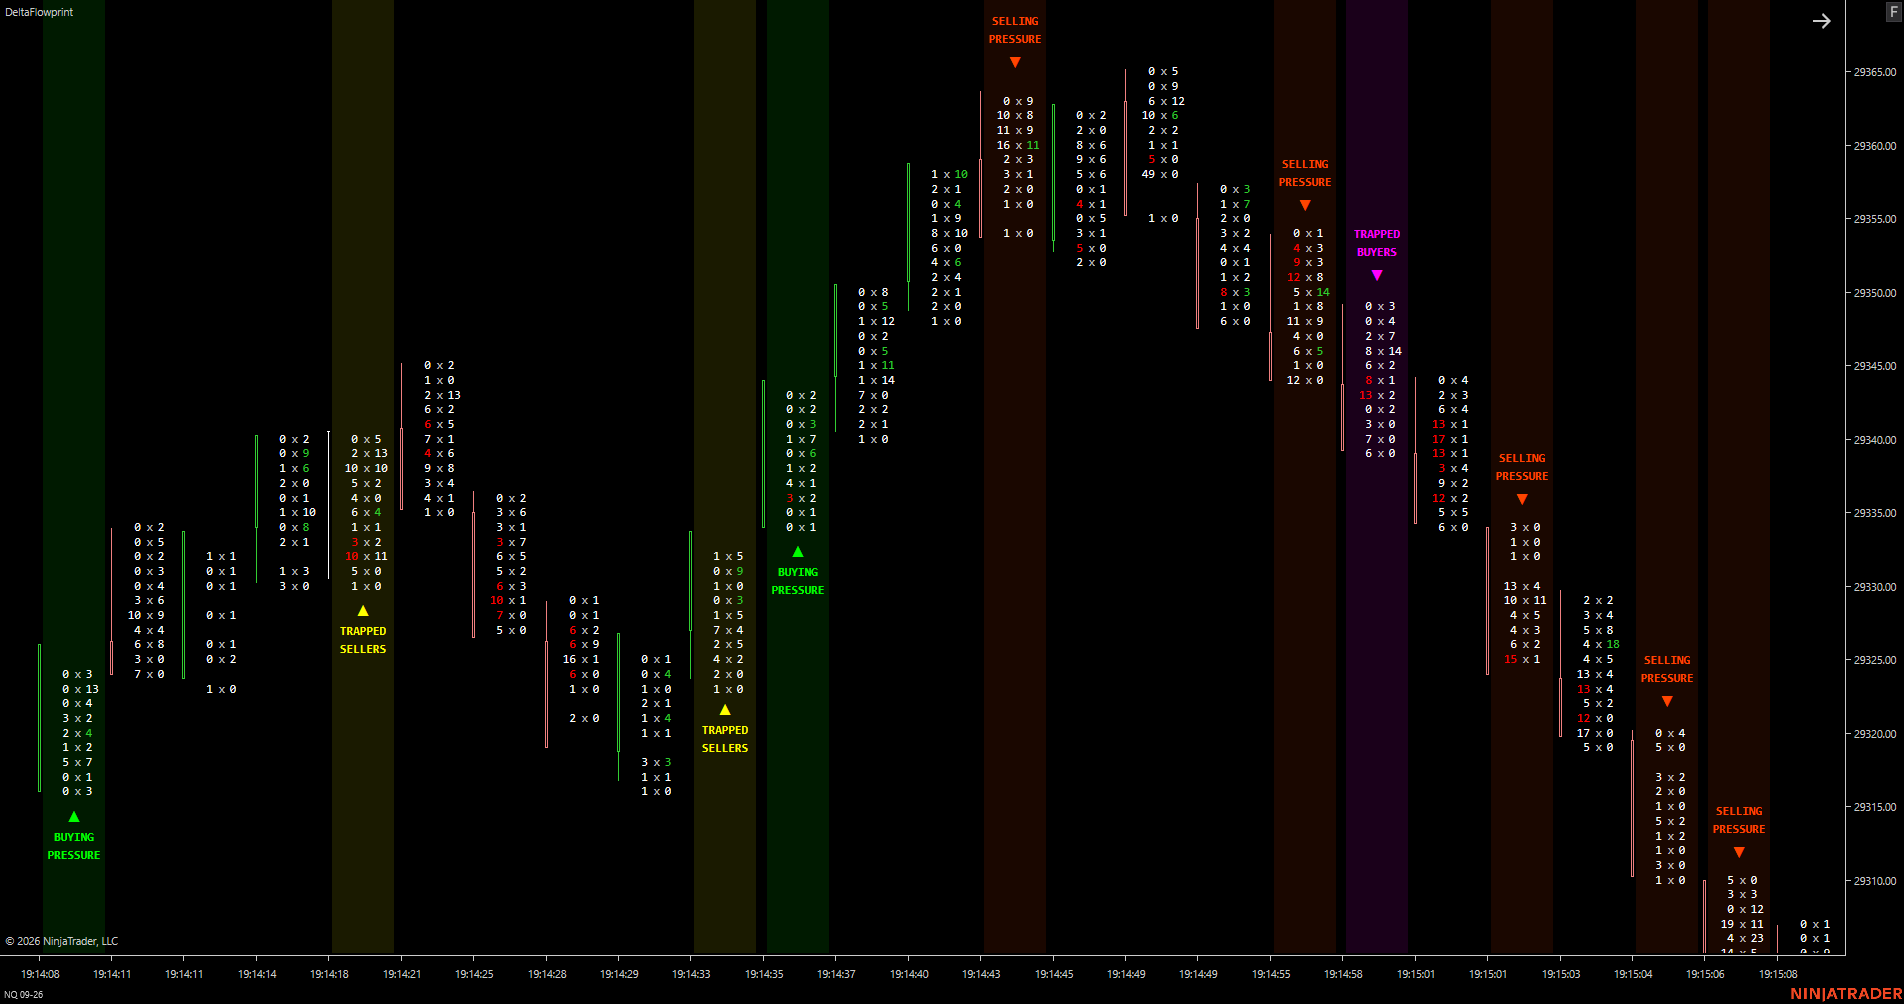
On a candlestick chart, range size mostly changes how choppy the chart looks. On a footprint, it changes how much order flow gets bucketed into a single bar — which directly changes whether signals like Trapped Buyers/Sellers and the pressure signals fire on genuine, complete auctions or on arbitrary slices of one.
A starting framework
- Tighter range (e.g. 10 range on ES): more bars, faster signals, more noise. Suited to scalping and fading sharp, short-lived moves.
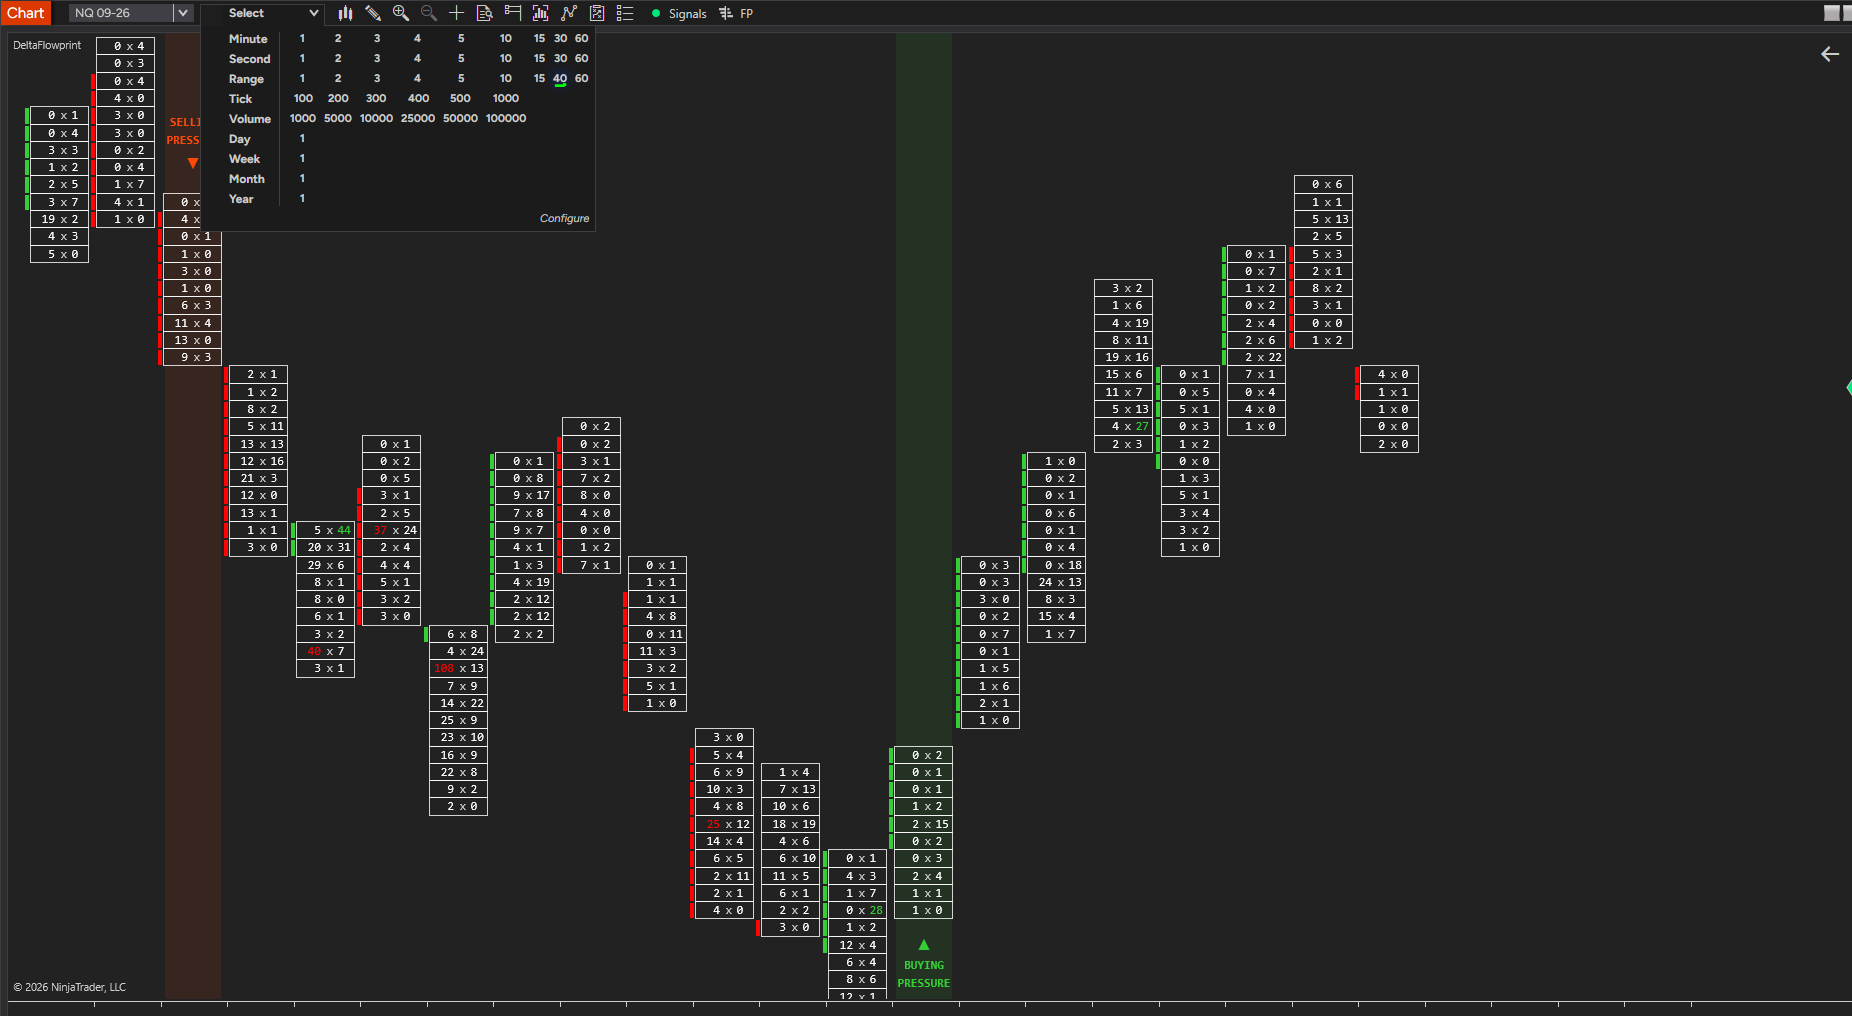
- Wider range (e.g. 40 range on ES/NQ): fewer bars, each one representing a more complete auction. Suited to reading Trapped Buyer/Seller signals with more conviction, at the cost of later entries.
- Tick bars: a useful middle ground when volume is inconsistent across the session — they normalize for trade count rather than price movement.
Matching range to instrument
NQ's larger point value and faster intrabar swings mean a range setting copied directly from ES will typically feel too tight — bars close before the auction has said much. Start from the instrument's average true range on a 1-minute chart and scale the footprint range as a fraction of that, then adjust after watching a full session live.
The mistake to avoid
Changing range size mid-session to chase whichever setting would have caught the last move. Pick a setting based on the setup you are trading — reversal, scalp, or continuation — and hold it for at least a full week of sessions before judging it.