Seven display modes. Four bar signals. Six cell highlights. Volume profile. Summary table. Every feature documented with what it shows you and why it matters.
Each mode renders the raw tick data differently. Switch instantly from the config panel — no chart reload needed (except Volume/Delta which compress bar spacing automatically).
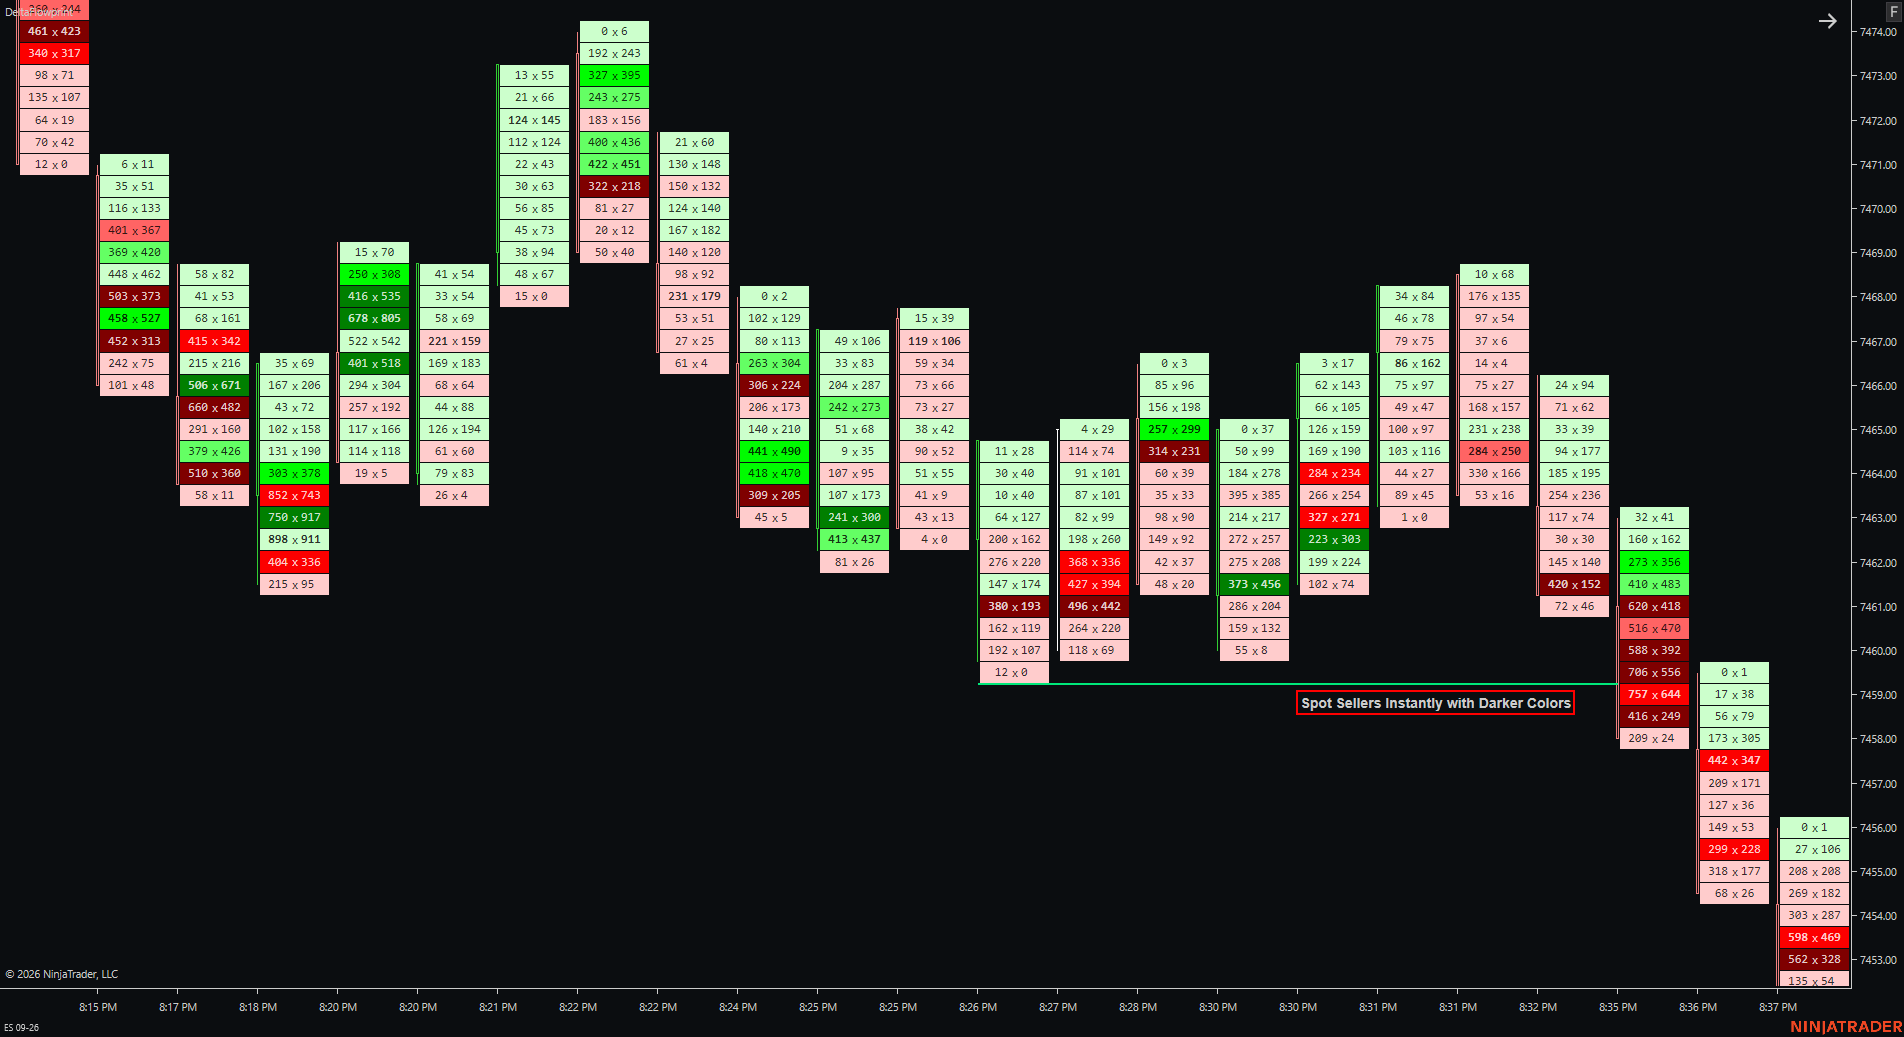
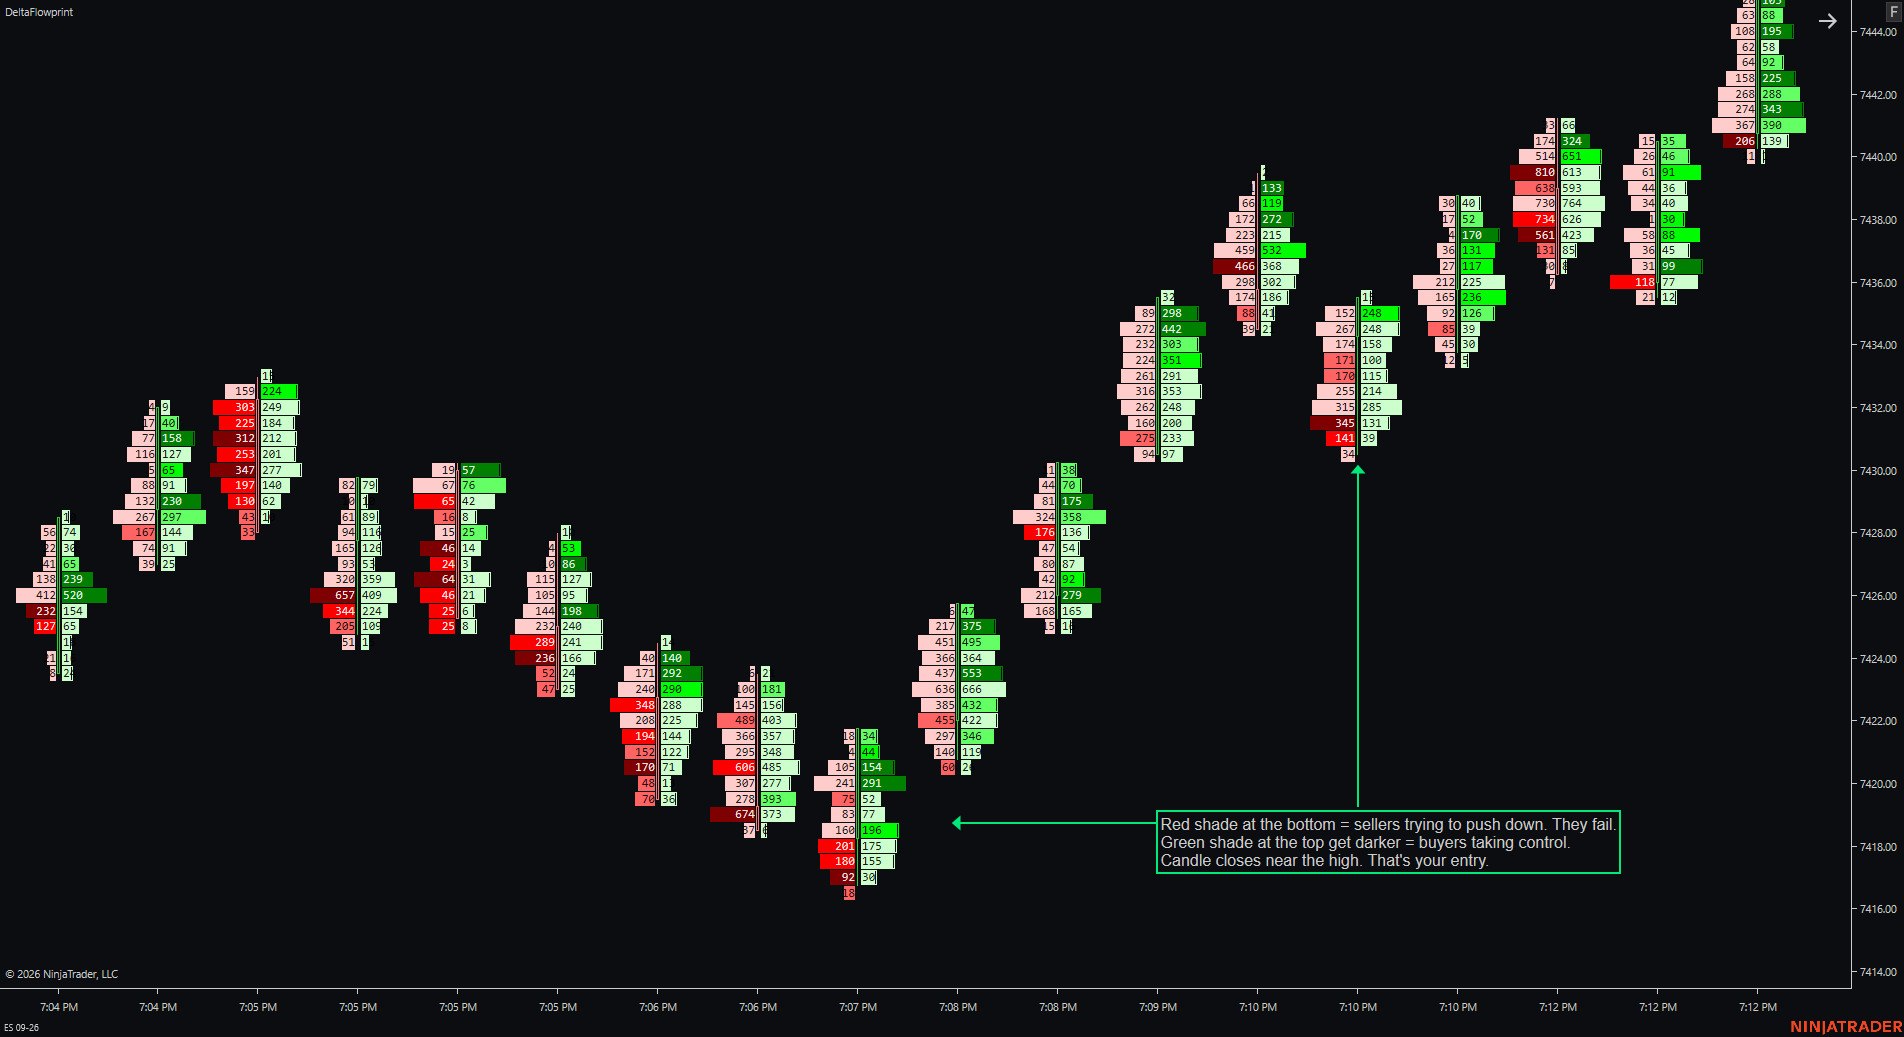
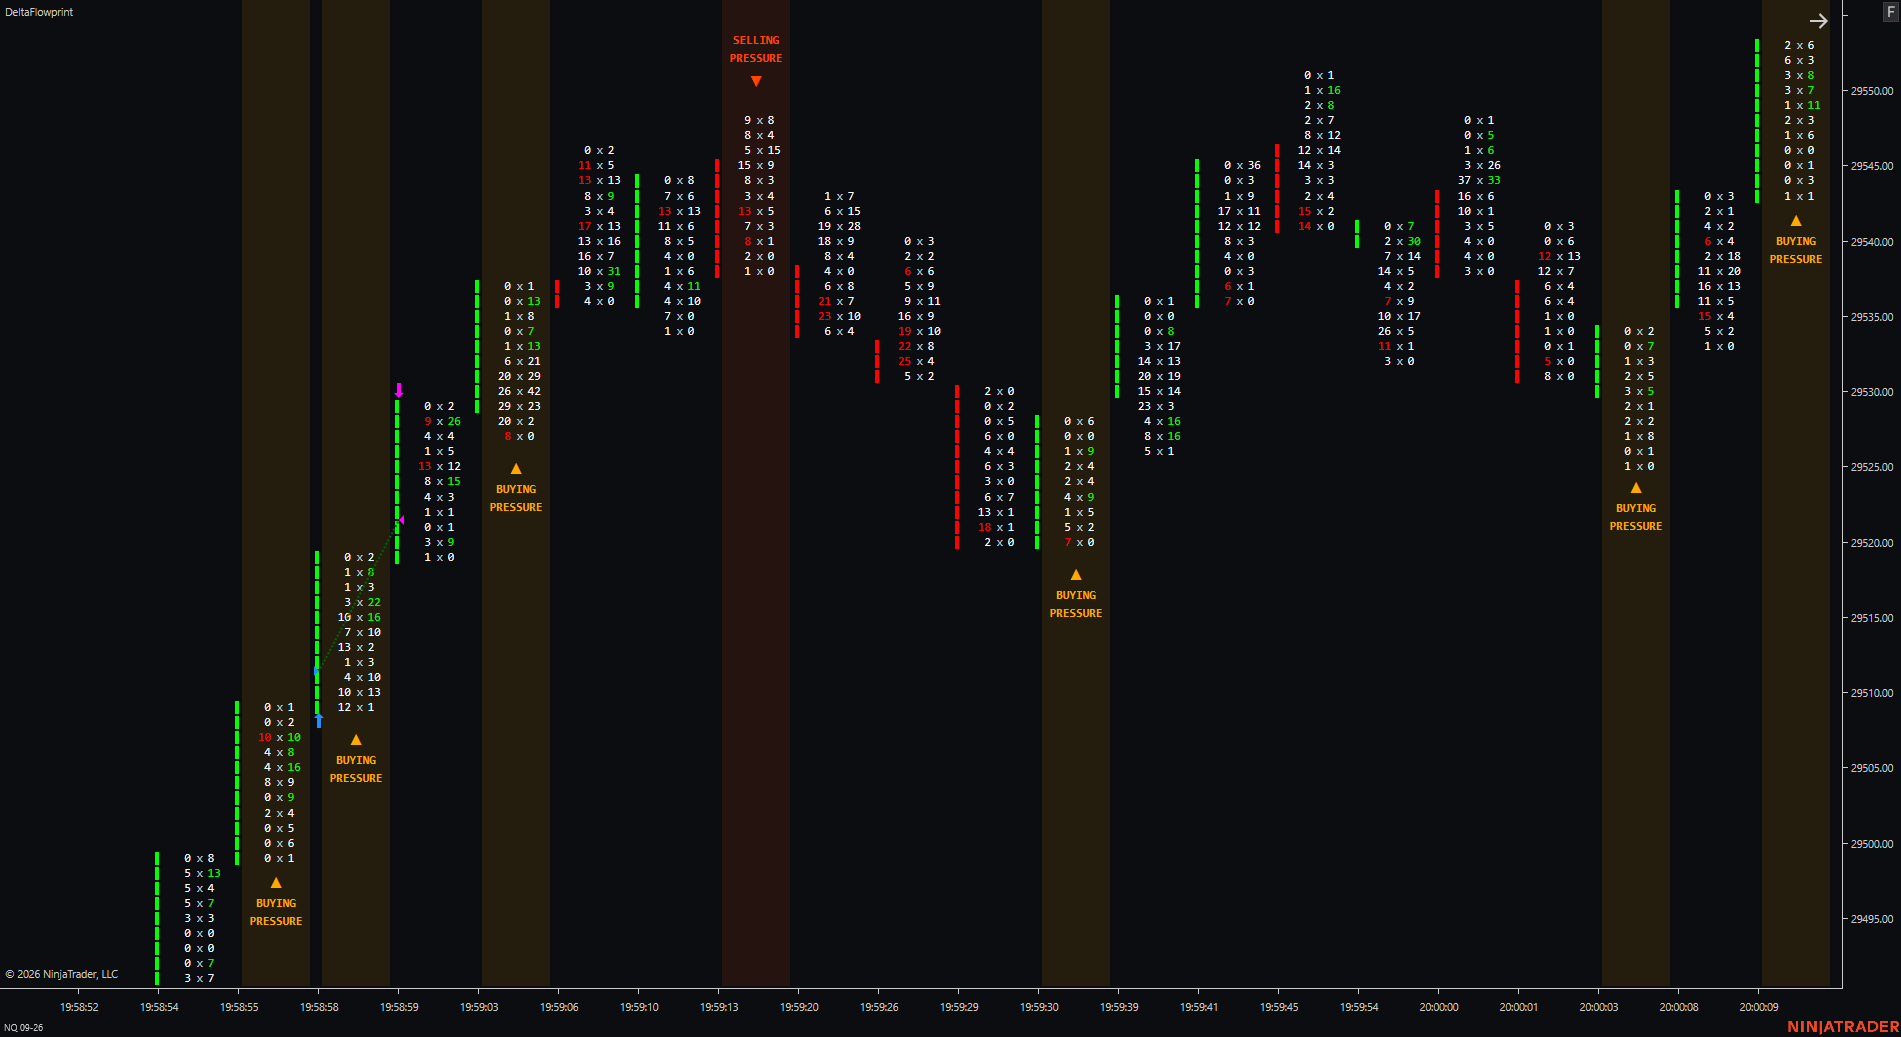
The standard footprint. Every price level shows raw bid volume on the left and ask volume on the right, separated by ×. Cells are colored green (ask dominant) or red (bid dominant) with up to 4 shade levels based on delta or volume magnitude.
Same bid/ask data but bar width scales with volume using square-root normalization — both sides reference the same maximum. When bid bars stay flat but ask bars explode, that's absorption in real time. The single most powerful mode for spotting institutional accumulation inside a bar.
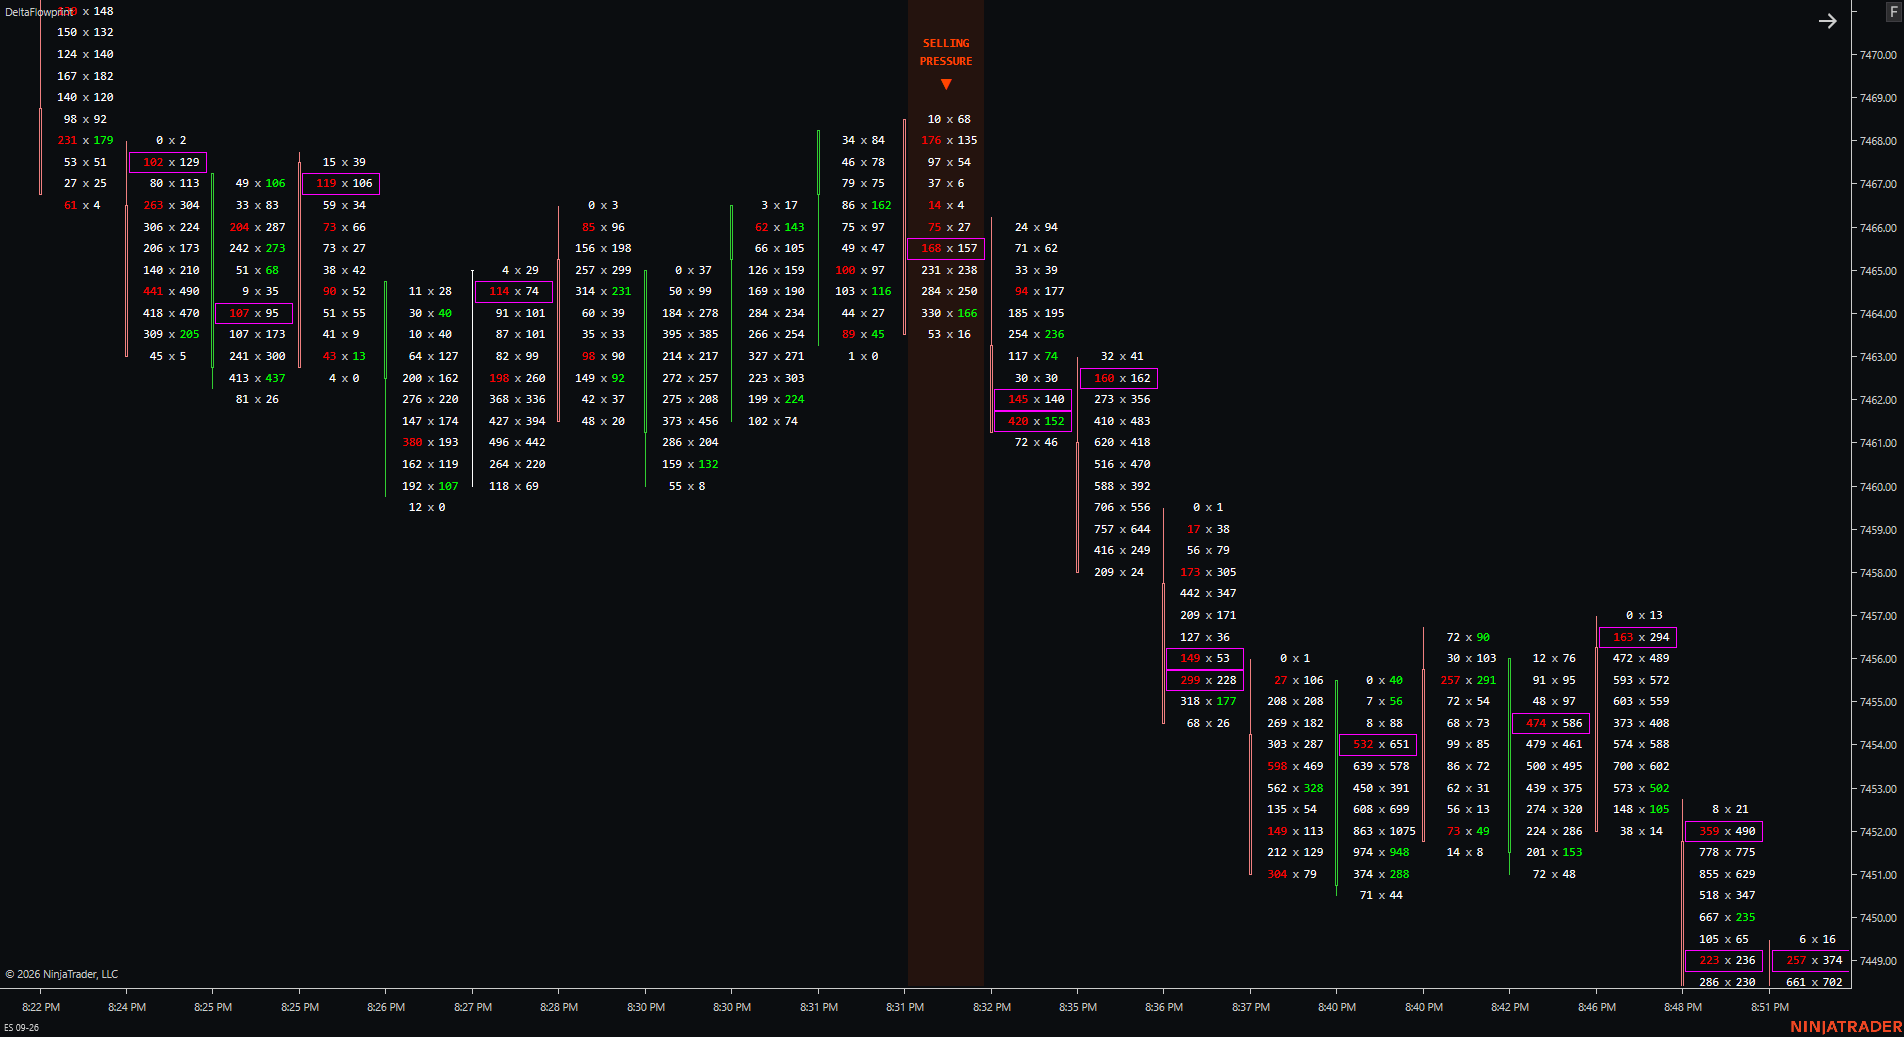
Shows raw numbers but uses a diagonal comparison — ask at this level vs bid one tick below (buy imbalance), or bid at this level vs ask one tick above (sell imbalance). When one side is a configurable multiple of the other, it fires in color. Everything below threshold stays neutral.
Remaining Modes
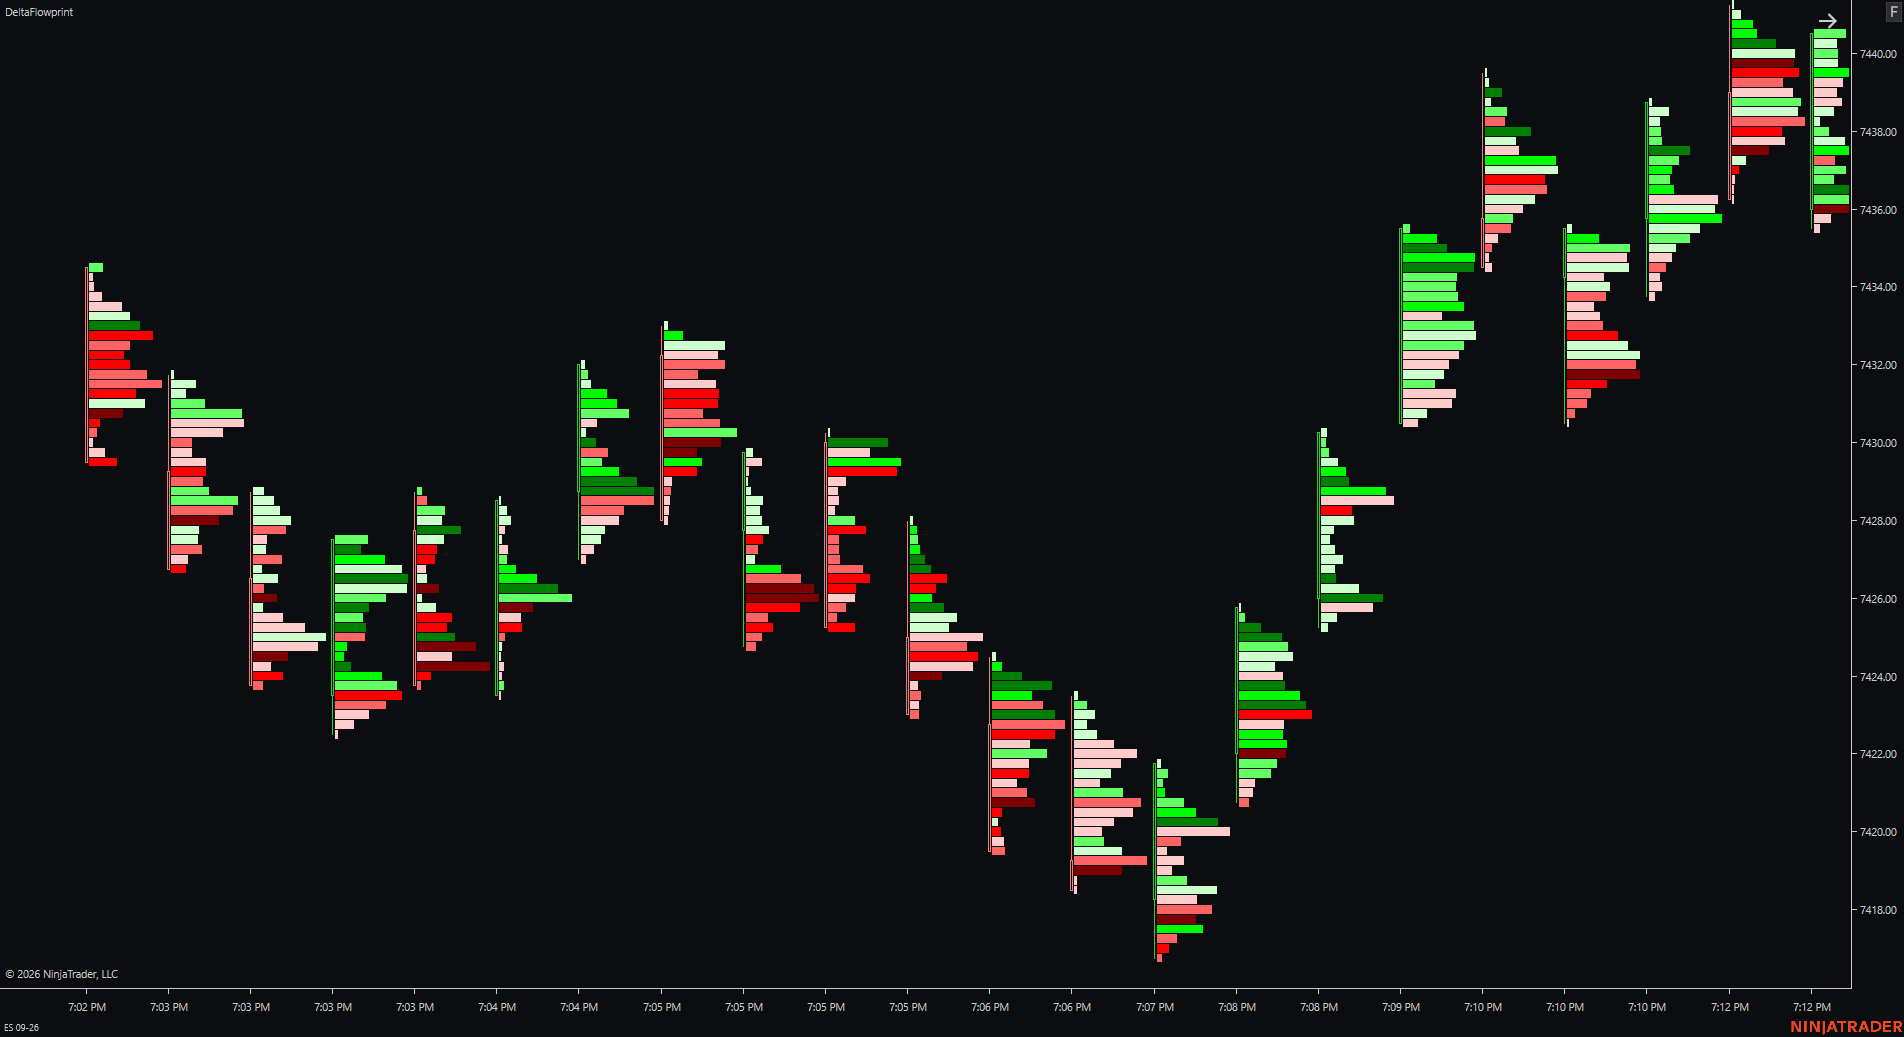
Volume profile per bar — bar width proportional to total volume at each price. Colored by whether ask or bid is dominant at that level.
Best for seeing auction structure and value inside a bar.
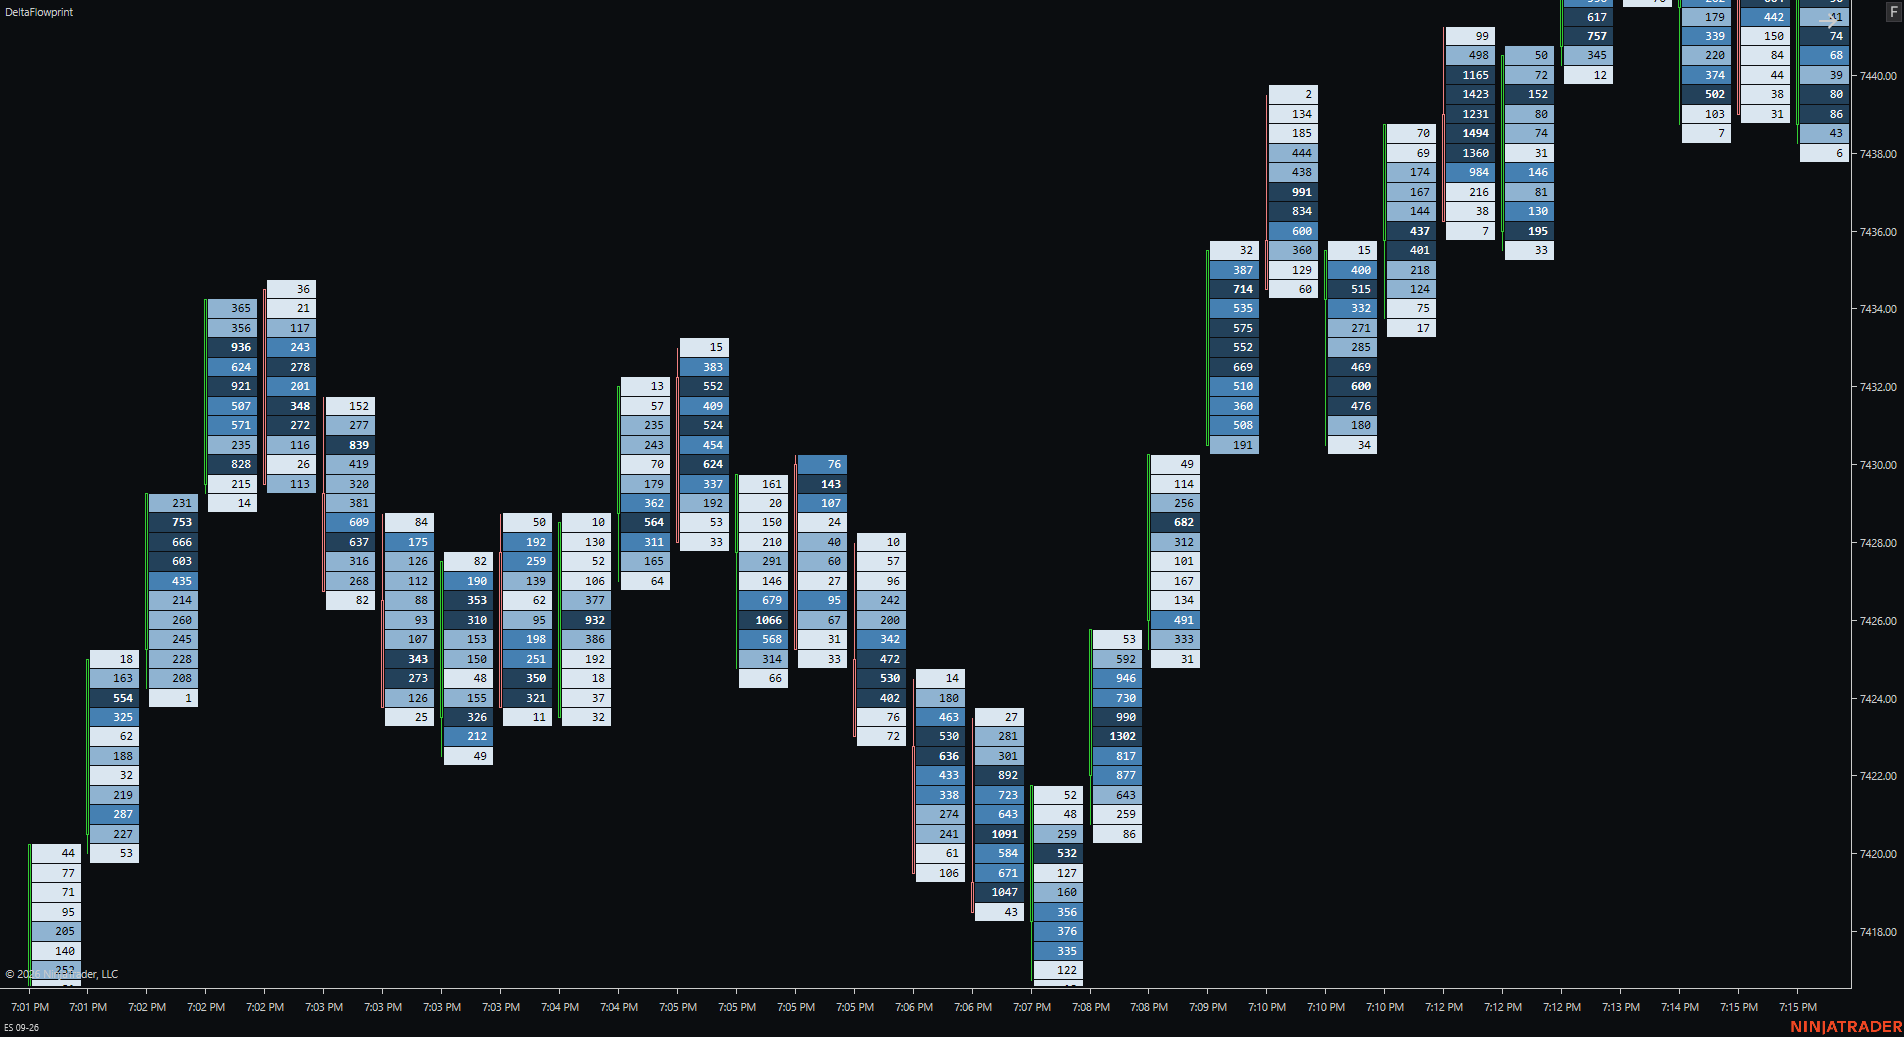
Single merged cell per price level. Total volume (bid+ask) drives both shading and width. 4 quartile shades from lightest (bottom 25%) to darkest (top 25%).
Best for seeing where the most activity happened, not who caused it.
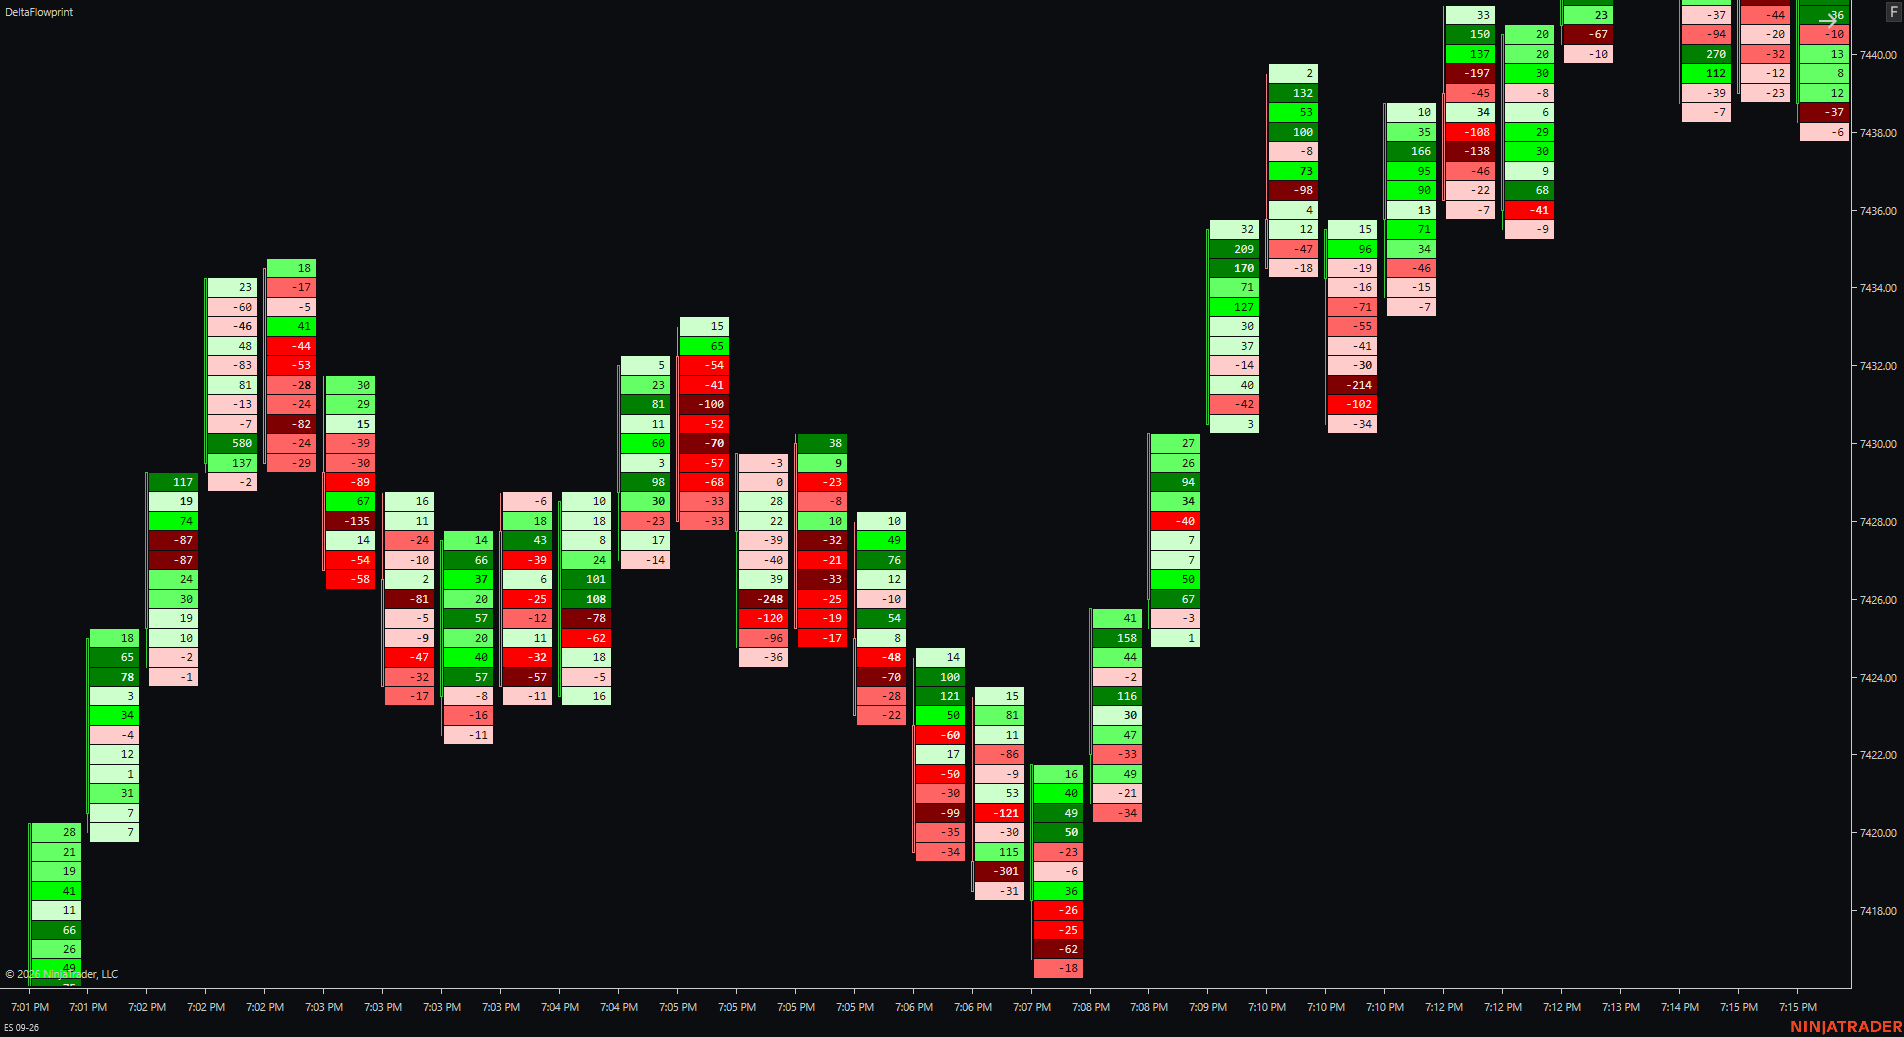
One cell per price level showing ask−bid. Positive delta = green, negative = red. Shade intensity = delta magnitude relative to bar max delta.
Best for seeing directional conviction at each price level quickly.
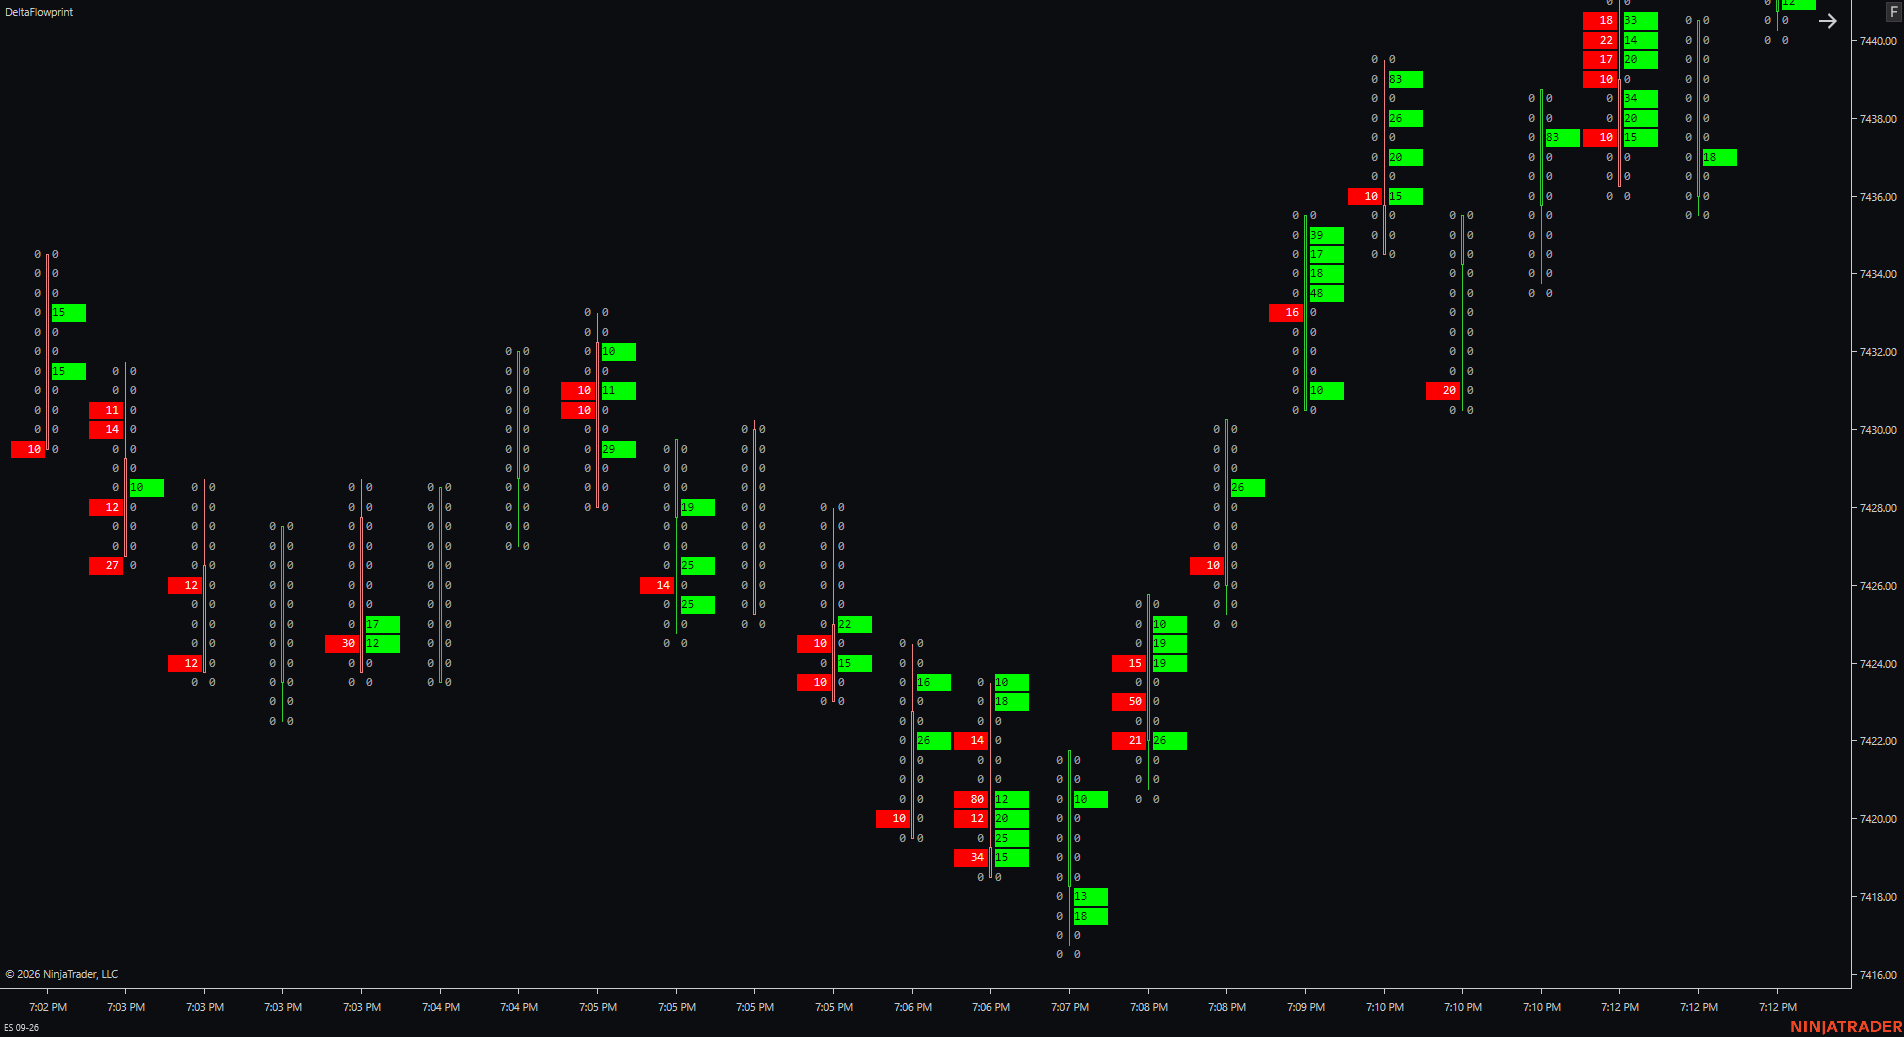
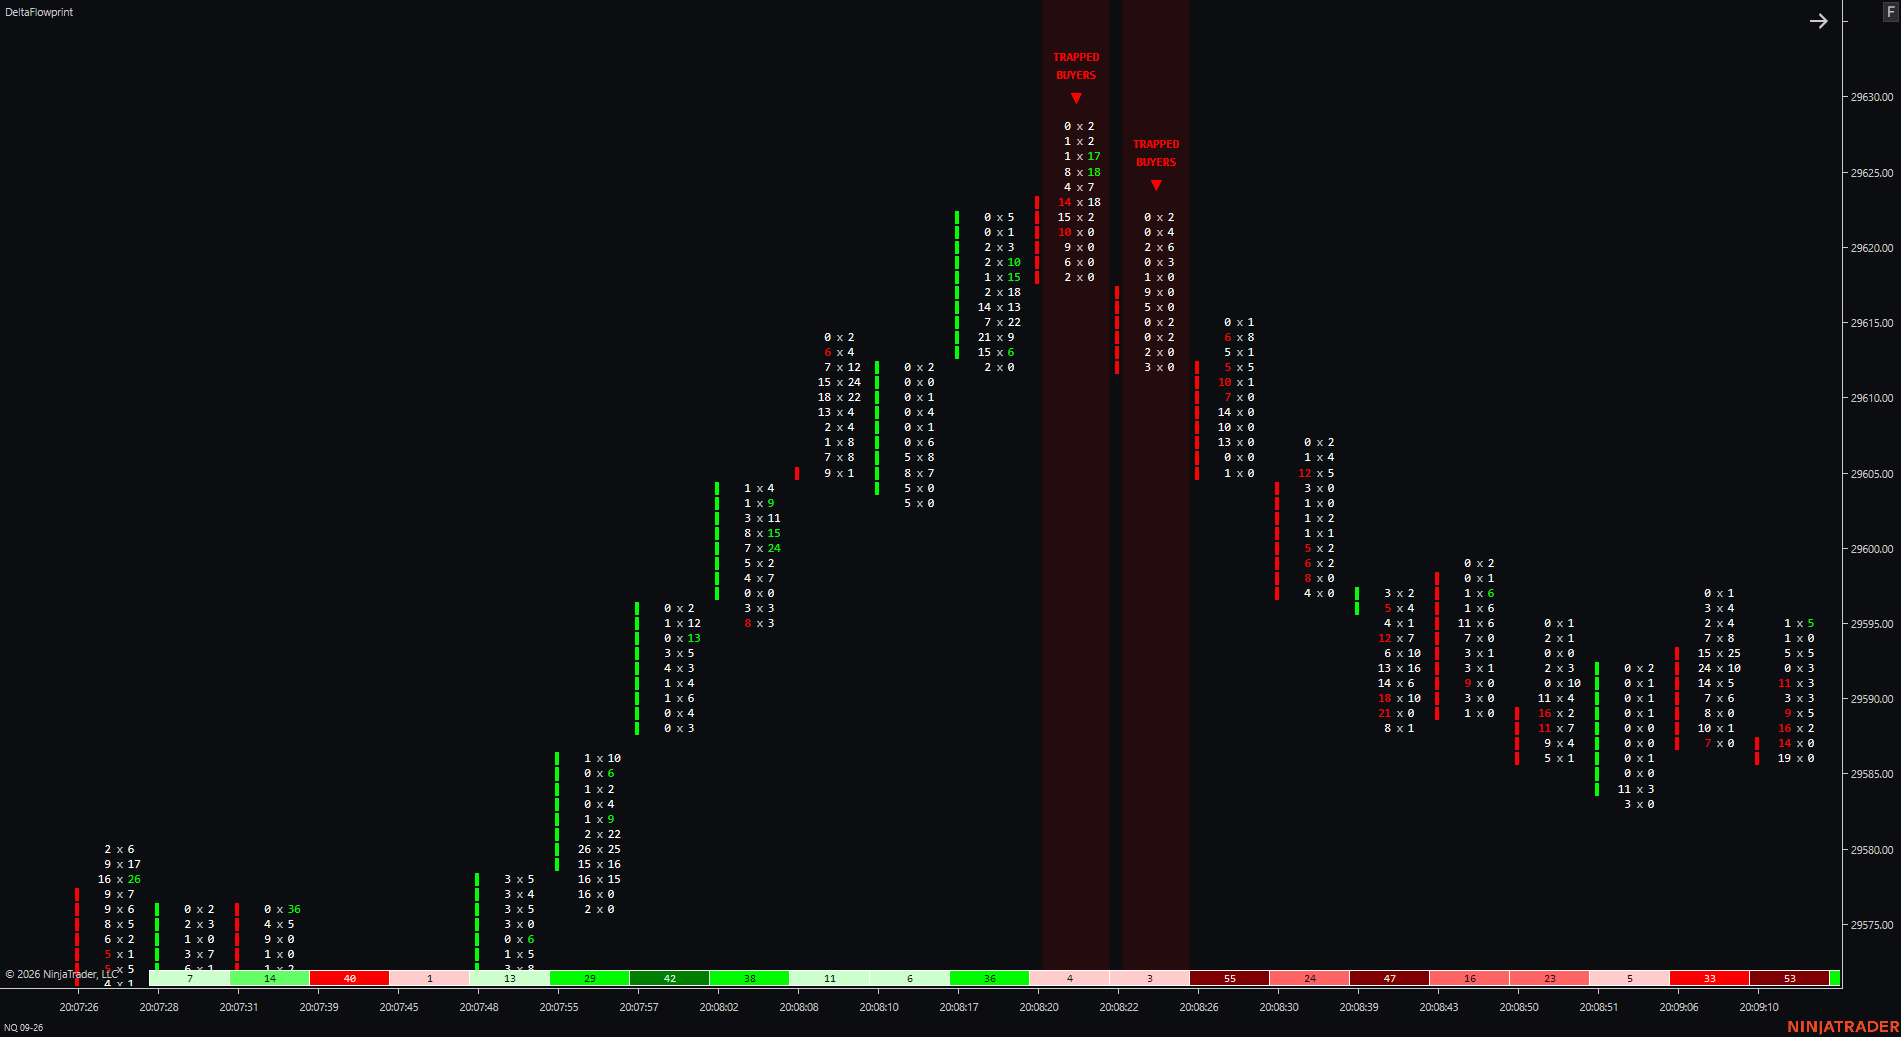
Shows only individual trades above your Threshold. Bid side (left) and Ask side (right). Everything below threshold shows as 0. Filters all noise — only institutions remain.
Best for catching single large orders that signal intent.Each signal highlights the entire bar column with a semi-transparent overlay and label. They fire when specific order flow conditions are met on the closed bar — no repainting.
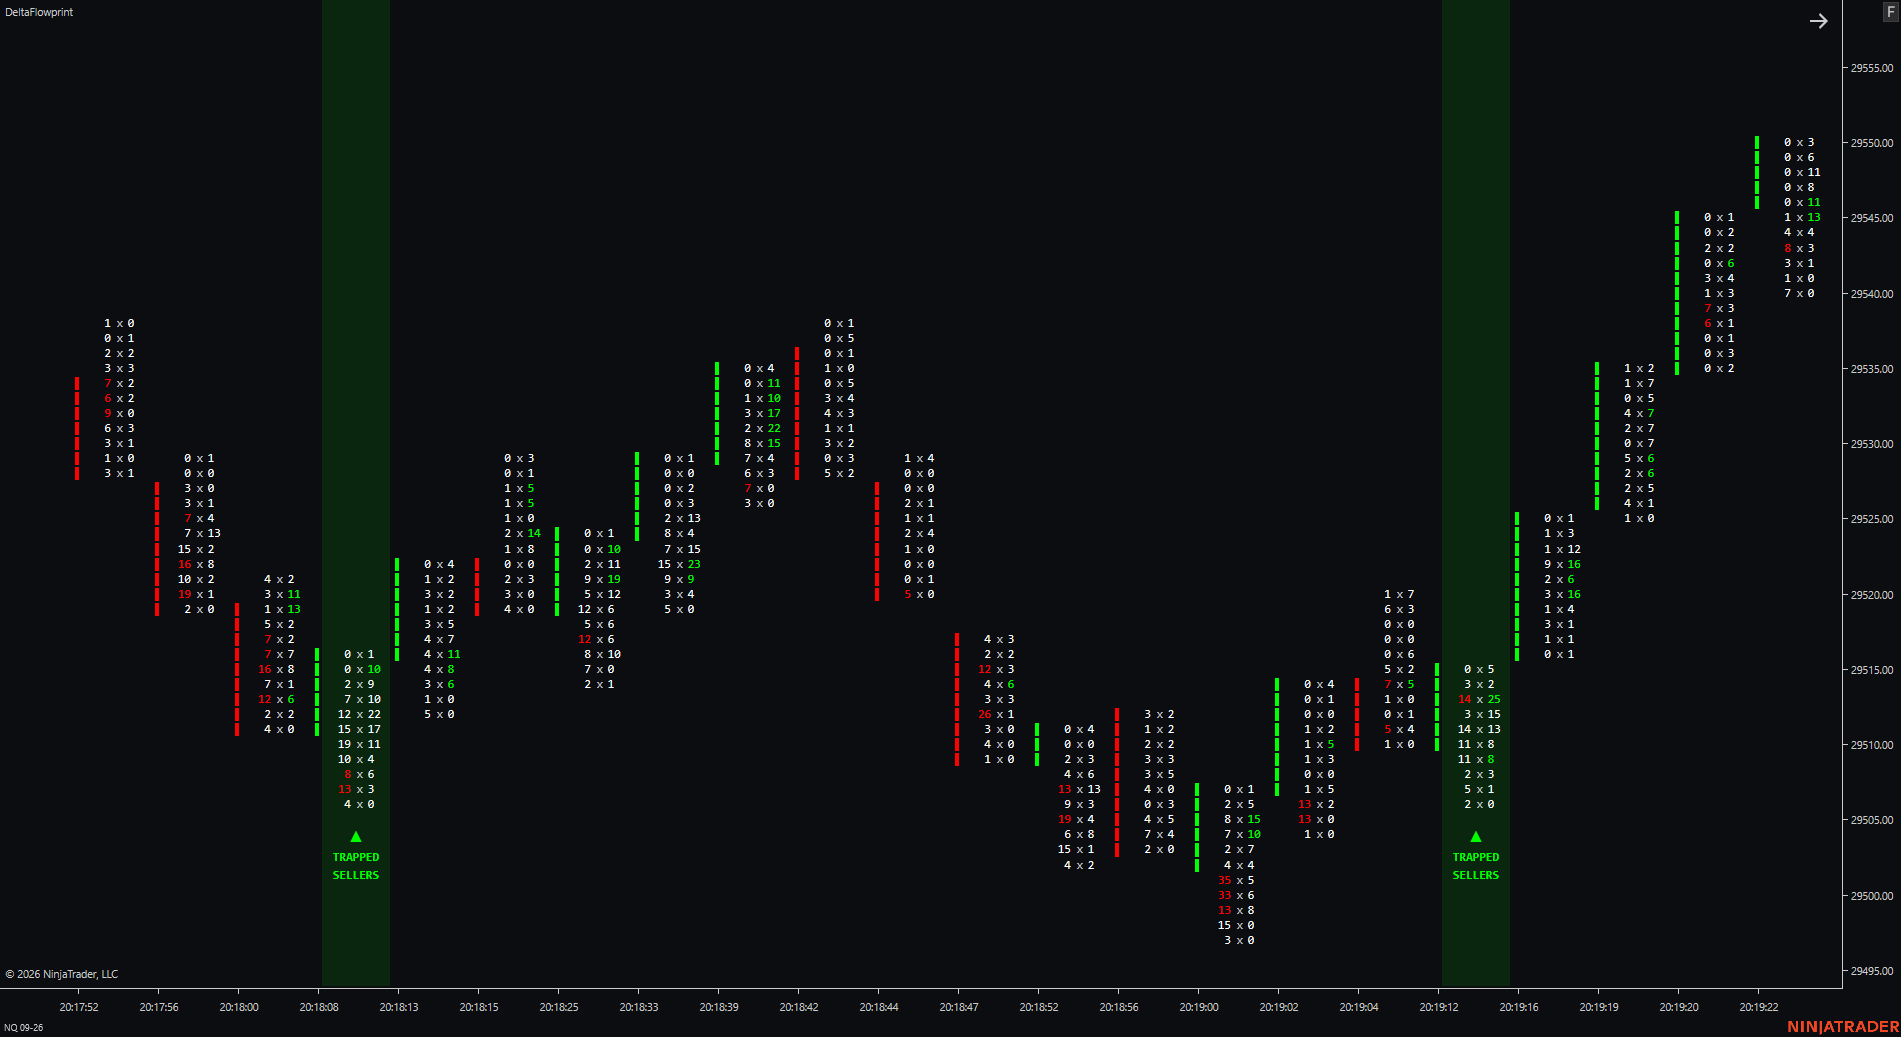
The bar closed near its HIGH. Sellers pushed price down during the bar — but bid volume in the lower zone was absorbed and the bar delta finished positive. Those sellers are underwater. When they exit, price accelerates up. Their stop-loss is your entry.
The bar closed near its LOW. Buyers pushed into the top of the bar — heavy ask volume at the upper zone — but price rejected and closed near the bottom. Bar delta went negative. Those buyers are now losing. When they give up, price dumps fast.
Simpler dominance signals. Buying Pressure fires when ask-dominant price levels exceed a threshold percentage of all levels in the bar — buyers controlled the majority of the tape. Selling Pressure is the mirror. Neither requires a price rejection.
Per-signal configuration
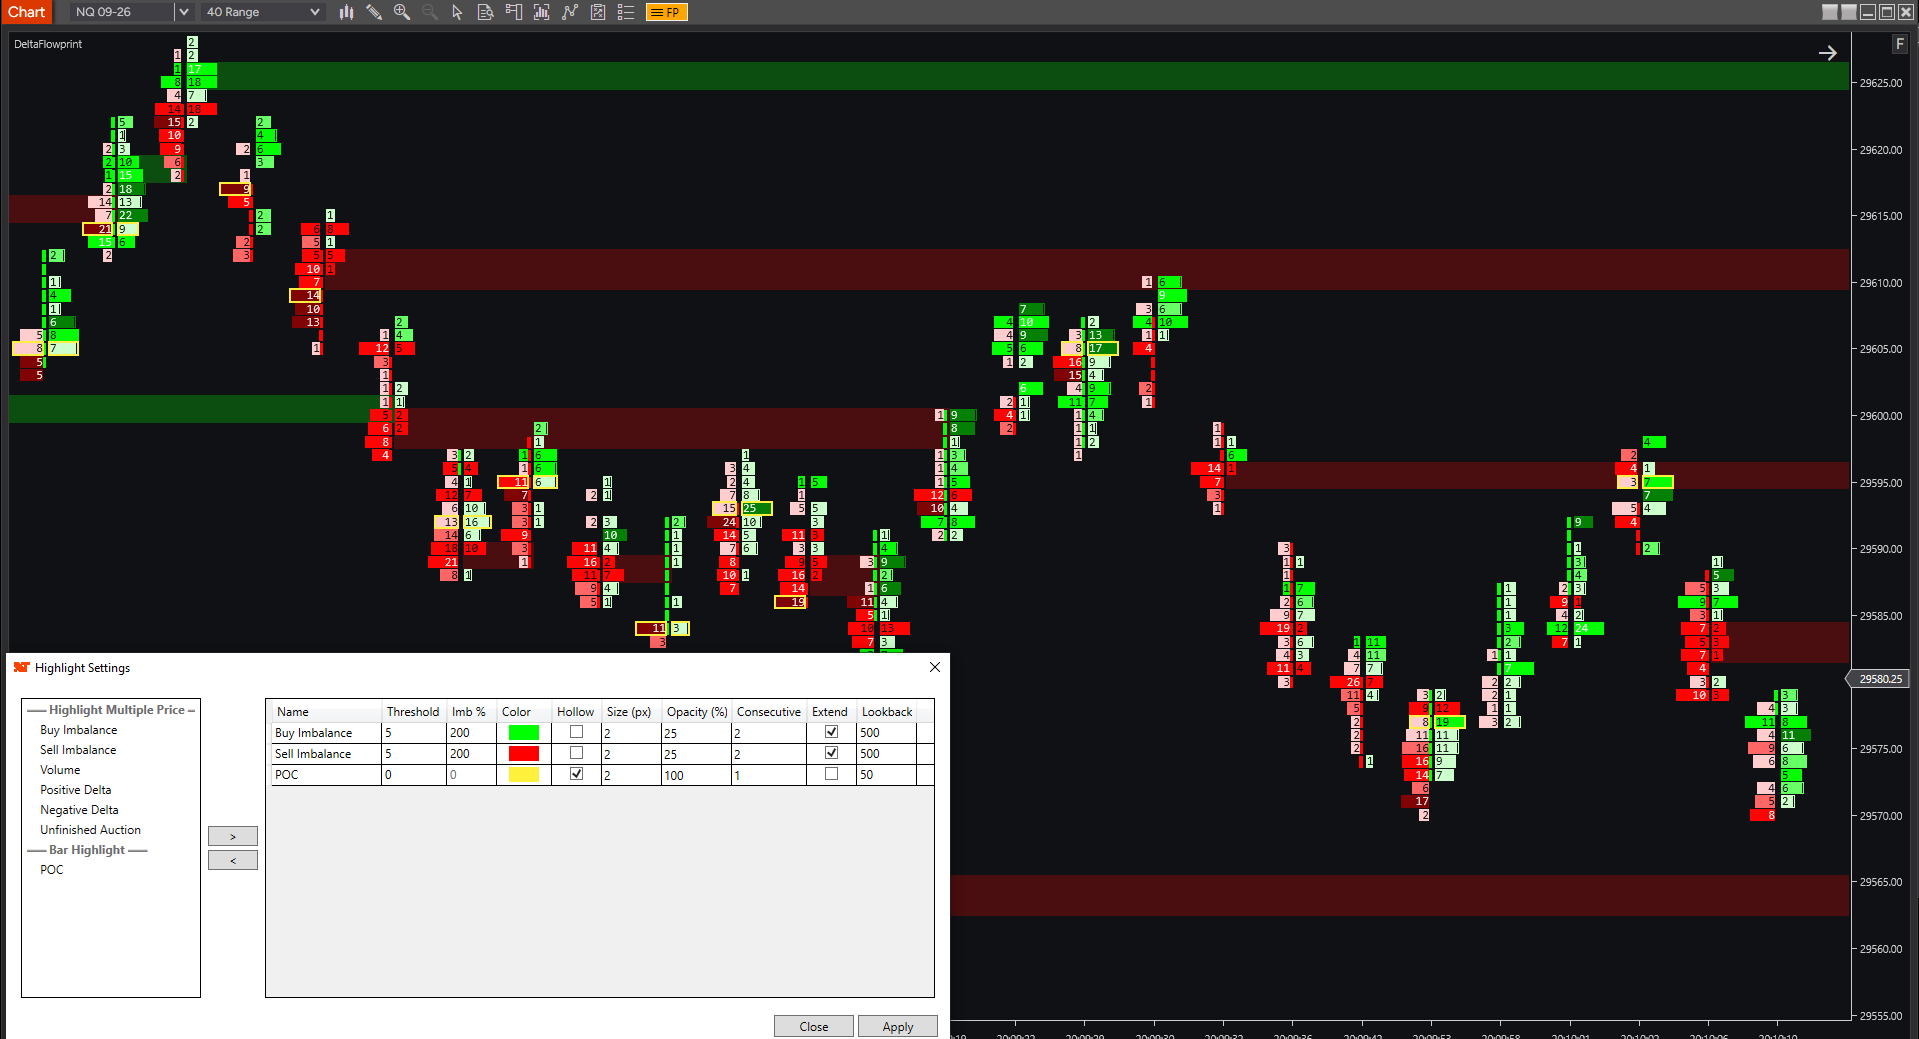
Highlights fire at individual price levels within each bar. Enable Extend to draw them forward as horizontal zones — they stop automatically when price crosses the level. Every parameter is fully configurable.
The correct diagonal footprint comparison. Ask volume at this level is a configurable multiple of the bid volume one tick below. When buyers are stacking diagonally, each matching cell is highlighted. Requires both a volume minimum (Threshold) and a ratio (Imbalance%).
Mirror of Buy Imbalance. Bid at this price vs ask one tick above. When sellers are dominating the diagonal, the cell lights up. Combines with Trapped Buyers signal for high-conviction short entries — both firing at the same bar is a strong confluence.
Marks cells where total traded volume (bid + ask) exceeds your threshold. High-volume price levels become the market's natural memory — they act as support and resistance on revisits. Enable Extend to draw these levels forward automatically and never lose an important level.
Marks individual price levels where buying aggression dominated with a magnitude above your threshold. Useful for isolating exactly where large directional buying bets were placed inside a bar — not just that the bar was bullish, but which specific tick.
Mirror of Positive Delta. Marks where selling aggression dominated at a specific tick. Stack this with Sell Imbalance to build multi-layer evidence for a short setup — both signals firing at the same price level is a very high conviction configuration.
Both bid and ask traded at the bar's extreme tick. Price left the level without finishing the auction — market theory says it's likely to return. The hollow box style default makes it visually distinct. Fires only at the very top or bottom tick of each bar.
Point of Control — the single price level where the most total volume (bid + ask) transacted within the bar. The bar is already bold at the POC row, but adding this highlight with Extend lets you draw POC levels forward as persistent zones across the chart.
EXTEND — How it works
Enable Extend on any highlight and set a Lookback (number of bars). DeltaFlowprint draws a horizontal zone from the highlighted cell forward in time. It automatically stops when price crosses the level — not just touches it. Consecutive setting merges adjacent cells into one clean zone.
CONSECUTIVE — Stacking filter
Consecutive = N means the highlight only fires if N or more adjacent price levels all meet the condition. Setting Consecutive = 3 on Buy Imbalance means you only see clusters of 3+ stacked diagonal imbalances — the high-conviction setups, not every minor spike.
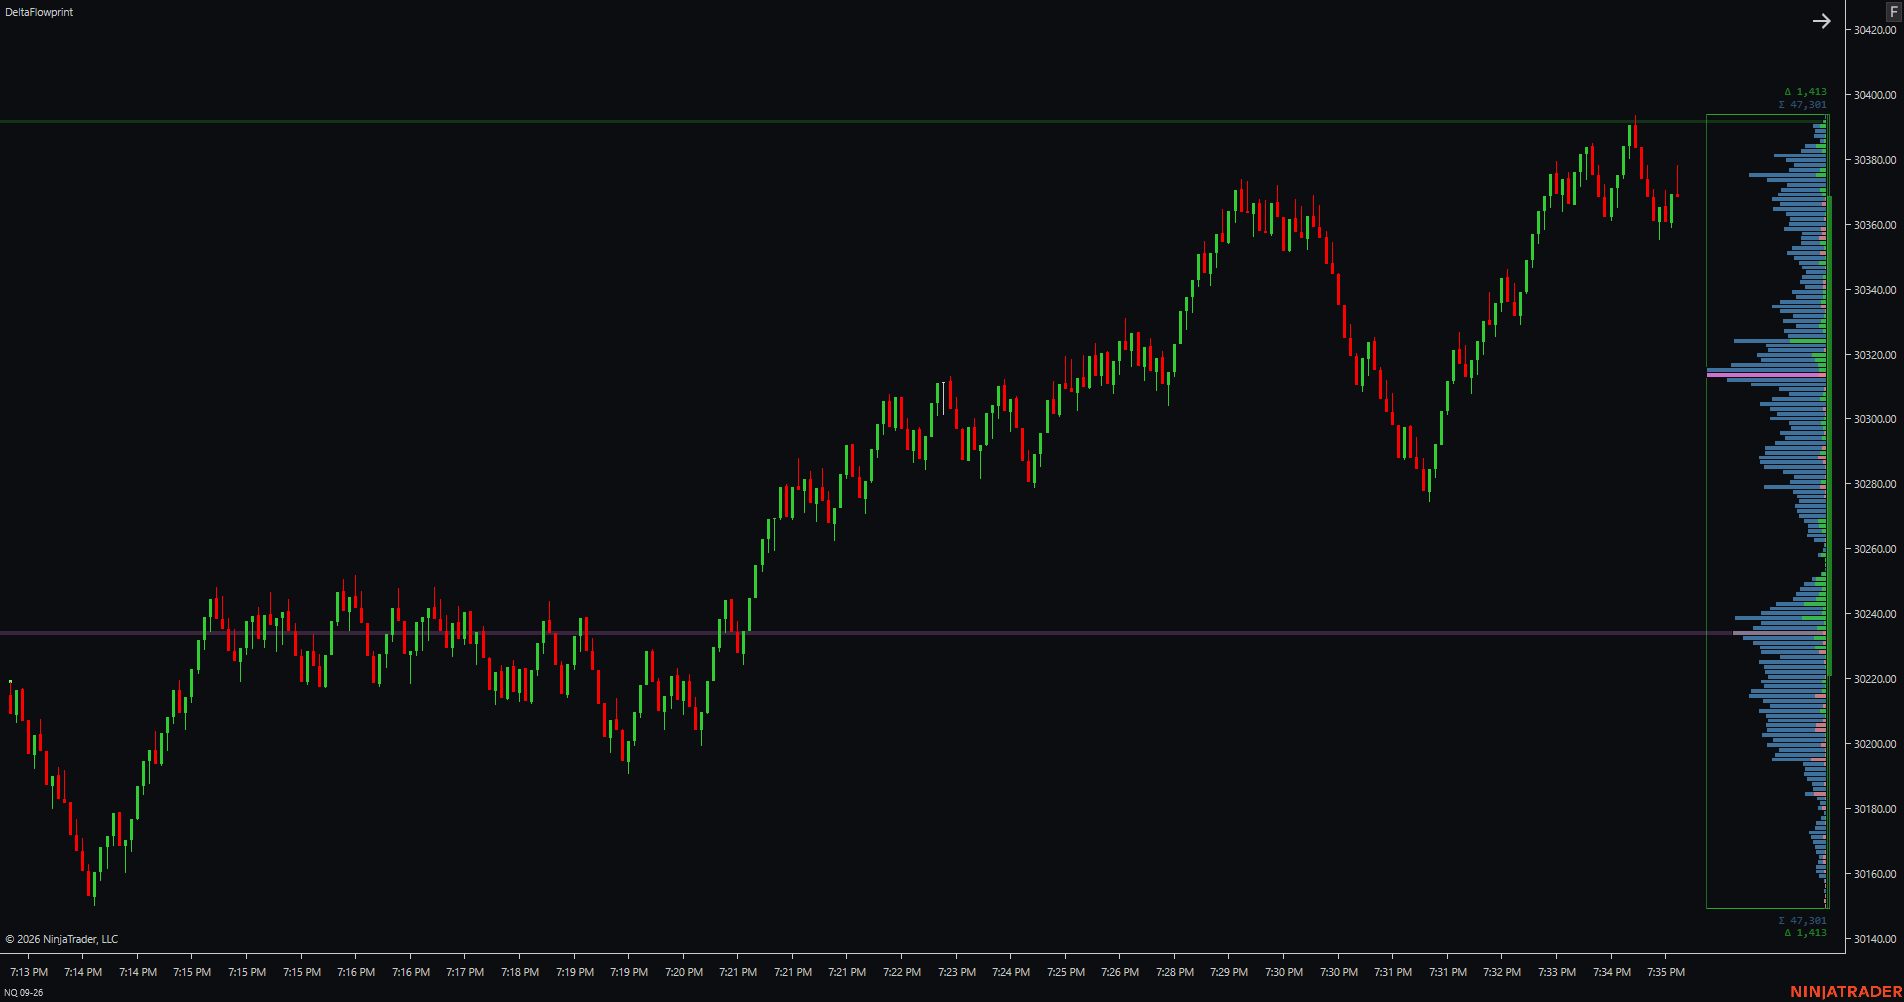
The rolling session volume profile updates tick-by-tick in real time. It aggregates bid and ask separately so you can see not just where volume happened — but who drove it.
The profile accumulates from the first bar of the session. It calculates POC (highest volume level), VAH (Value Area High), and VAL (Value Area Low) — the 68.2% of volume surrounding the POC. These are the three most important auction reference levels every trading session.
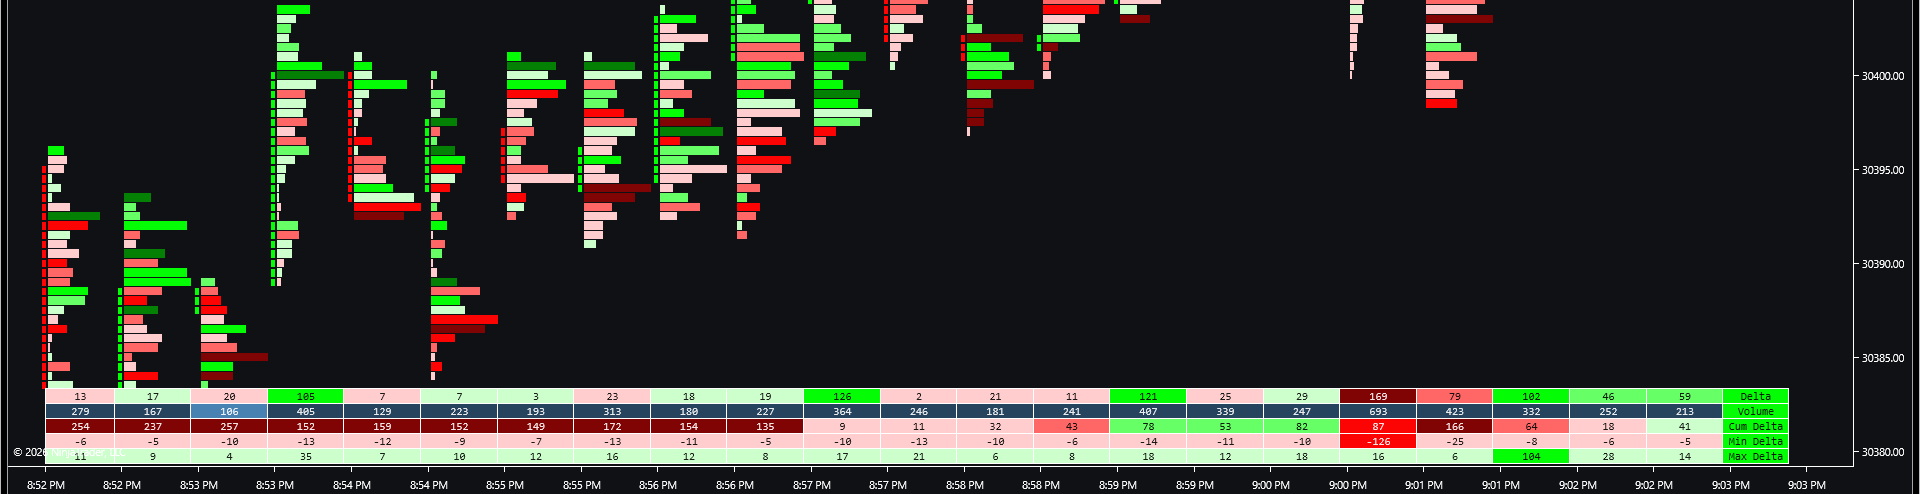
Optional rows of per-bar statistics displayed as colored cells at the bottom of the chart. Each row is independently toggleable. Colors are driven by magnitude — not just sign.
Net delta (ask − bid) per bar. Positive = green, negative = red. Shade intensity is relative to the maximum delta visible on screen — the darkest cells are the most decisive bars.
Total volume per bar using the same 4-quartile shading as the Volume mode cells. Instantly see the heaviest volume bars across your session.
Running session delta. Starts at zero on the first bar of session and accumulates. Divergence between price direction and cumulative delta often leads price.
The lowest (most negative) delta at any single price level within the bar. Shows the worst sell pressure that hit inside the bar — even if the bar closed bullish.
The highest (most positive) delta at any single price level within the bar. Shows the strongest buying burst — even if the bar closed flat or bearish.
All settings are accessible from the FP⬡ button in the NinjaTrader toolbar. Changes apply instantly — no chart reload except Tick Aggregation and Compact Mode.
$197 one-time. Lifetime license. Every future mode and feature included free.
Get DeltaFlowprint →